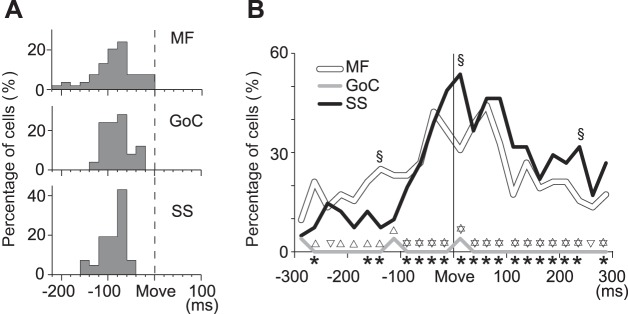
Fig. 8.
Cell-type specific properties of activities of MFs, GoCs, and PCs. A: distribution of modulation onsets relative to movement onset; n = 54 MFs, 25 GoCs, 42 PCs (SS). B: percentage of each neuron type with significant directionality in both forearm postures. Directionality was evaluated in 25-ms bins during the time window of ±300 ms relative to movement onset; n = 54 MFs, 25 GoCs, 42 PCs (SS). Asterisks below the abscissa indicate a significant difference (P < 0.05) in X2-test among the 3 neuron types (MFs, GoCs, PCs). Normal triangles above the GoC line indicate a significant difference (P < 0.05) in X2-test between MFs and GoCs. Inverted triangles above the GoC line indicate a significant difference (P < 0.05) in X2-test between SSs and GoCs. Section signs (§) indicate a significant difference (P < 0.05) in X2-test between MFs and PCs.

