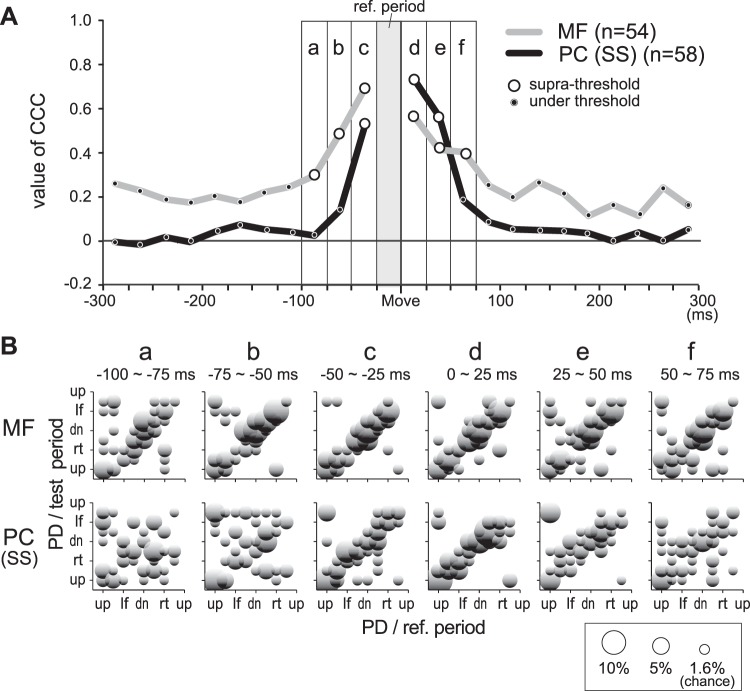
Fig. 9.
Temporal characteristics of PDs for MFs and PCs. A: coefficient of circular correlation (CCC) between PD in a reference time window (gray vertical column marked ref. period, −25 to 0 ms relative to movement onset) and remaining test windows for MFs and SSs of PCs. The ordinate is the value of CCC. Open circles indicate significant CCCs (P < 0.05), and dots indicate insignificant CCCs. We combined results from the 2 postures for this figure because PRO and SUP had similar results (not shown). Small letters a–f indicate the 6 time windows shown in B. B: comparison of PDs between the reference and test time windows for MFs (top) and PCs (bottom). The 6 scatter plots (labeled a–f) show PDs in the 6 peri-movement time windows indicated in A. Bin width = π/8. For this plot only, the values of PD were assigned to the nearest movement direction. We counted cells in each of the 64 grid points (8 directions in reference period × 8 directions in test period). The area of each circle indicates the percentage of cells with the same PDs in both the reference and test periods. Note that a random distribution of PDs would yield about 1.6% (1/64) at each grid point, or about 1 cell.

