Fig. 5.
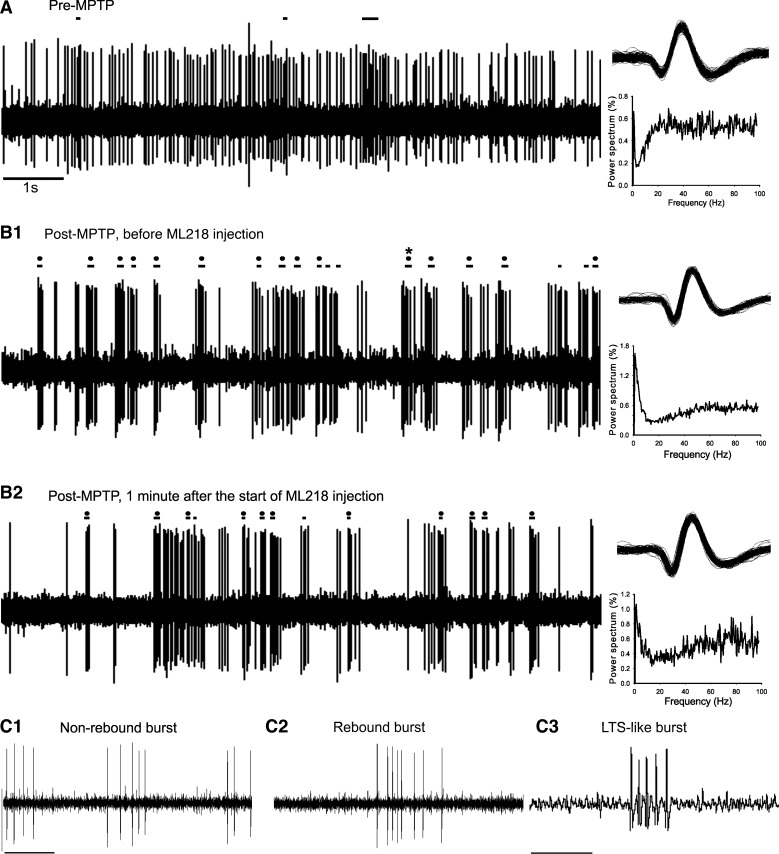
Effect of MPTP and ML218 on thalamic activity. Examples of 10 s of thalamic recordings and corresponding power spectra [normalized to the 1–100-Hz range; nonequispaced fast Fourier transform (nfft): 11; bin size: 0.49], before (A) and after (B) MPTP treatment. Same cell before (B1) and after (B2) ML218 injection. Horizontal lines above the recordings indicate events identified as burst. Horizontal lines with a black dot denote rebound bursts, and the 1 burst with an asterisk (*) was identified as a low-threshold spike (LTS)-like burst (see materials and methods). C: example of non-rebound burst (C1), rebound burst (C2), and LTS-like burst (C3). Original scale bars, 1 s (A; also applies to B); 0.1 s (C1; also applies to C2); 0.02 s (C3).

