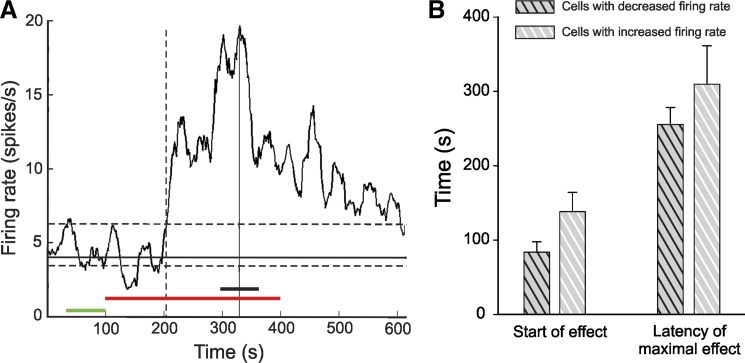
Fig. 7.
A: example trace of a thalamic neuron that increased its firing rate in response to ML218 injections. Green bar, 60-s control period; red bar, drug injection; black bar, maximal effect period; solid horizontal line, median firing rate at baseline; dashed lines, 90th and 10th percentiles; solid vertical line, maximal effect; vertical dashed line, moment at which the effect was considered to have started. B: delay of the onset of the ML218-induced effects and the timing of the maximal effect (both measured from the start of the injection), shown for cells with firing-rate decreases (black-striped bars) and cells with firing-rate increases (white-striped bars). Values are means ± SE compared with a Mann-Whitney rank sum test.

