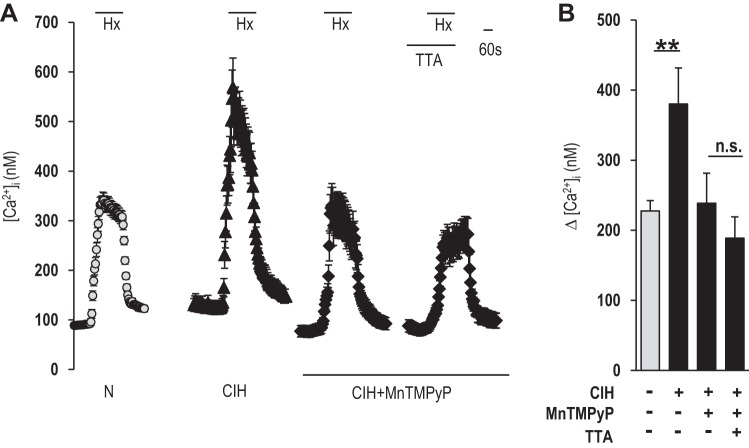
Fig. 5.
Role of ROS in CIH-induced Ca2+ responses to hypoxia in rat glomus cells. A: examples of hypoxia (Po2 34 ± 3 mmHg)-induced [Ca2+]i responses of glomus cells from rats treated with normoxia (n = 49 cells), CIH (n = 57 cells), or CIH and MnTMPyP (n = 38 cells), with and without 25 μM TTA-A2 (n = 44 cells). Horizontal bars represent the duration of the hypoxia and TTA-A2 challenges. B: average data (means ± SE) of hypoxia-induced [Ca2+]i responses of glomus cells presented as stimulus-evoked response minus baseline levels. **P < 0.01; n.s., not significant (P > 0.05).

