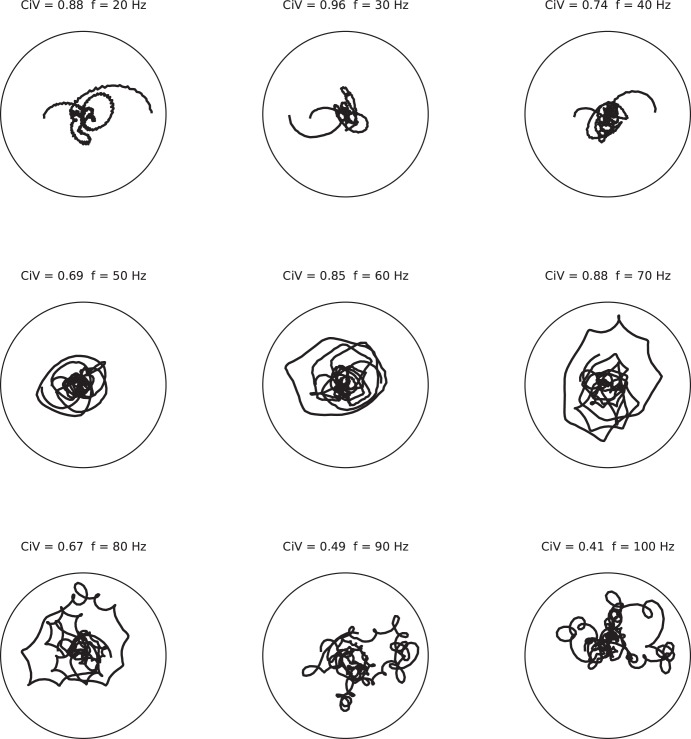
Fig. 6.
The phase is not constant within an epoch of oscillation. Displayed are “phase portraits” of one oscillation epoch for frequencies in the gamma range (20–100 Hz). The oscillation epoch had a peak frequency of 70 Hz and a duration of 200 ms. A phase portrait for a given frequency value is a parametric plot of the residual phase (represented by the angle) and the amplitude (radius) at consecutive points in time (parameter). Circular variation (CiV) is a measure for the degree of phase drift of that frequency component. The CiV values and the given frequency are shown above each graph. For comparison, a perfect sine wave at the given frequency would result in a point on this graph and a vanishing CiV value. In contrast, signals with a random phase result in a CiV value of 1.

