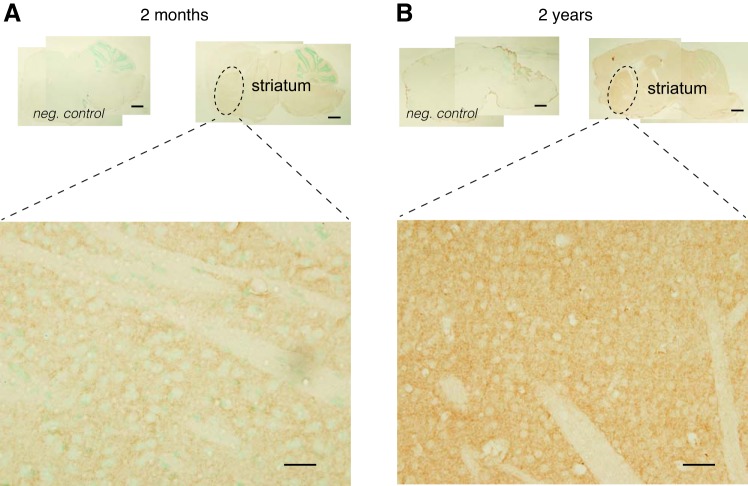
Fig. 5.
IHC analysis of D1R expression with age in the striatum. A, top: representative low-resolution micrograph of D1R expression in a sagittal brain section of a 2-mo-old animal (right) and its negative control (left). Bottom: high-resolution micrograph of a typical area within the dorsal striatum. Note that D1R-positive staining is present throughout the striatum. B: typical sagittal brain section from a 2-yr-old animal. Top: representative low-resolution micrograph of D1R expression in a sagittal brain section of a 2-yr-old animal (right) and its negative control (left). Bottom: high-resolution micrograph of a typical area within the dorsal striatum. Note that D1R-positive staining is much more intense throughout the striatum. Scale bars, 500 μm (top panels), 20 μm (bottom panels).

