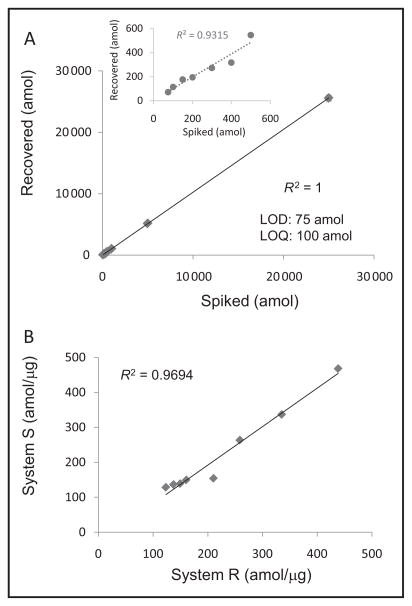
Fig. 1. Development of ALK SRM assay and assessment of assay precision.
(A), Calibration curve generated in Pfu. Inset, Calibration curve omitting the 3 highest concentrations (25 000, 5000, and 1000 amol). (B), Assessment of assay precision and reproducibility for measuring ALK protein concentrations in 8 ALK FISH+ NSCLC FFPE tumor tissues. Each sample was analyzed on 2 different LC-MS systems.

