
Figure 5.
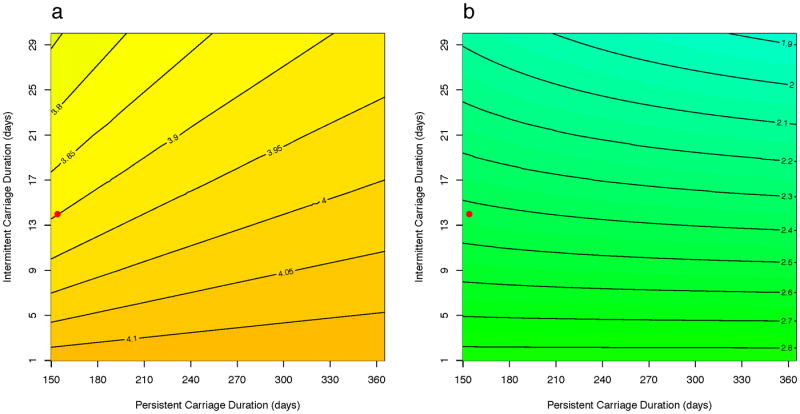
A heat-map of the ratios of carriage prevalence in the heterogeneous model to the homogeneous model when varying persistent and intermittent carriage durations under Scenario A (admission of those colonized is the proportion colonized among that host class) with intervention of (a) reducing β* parameter (see Table 1) by 25% and (b) setting δ parameter to 1/180 day-1. The ratio represents the magnitude of difference between the models, with >1 indicating that the heterogeneous model predicts higher carriage prevalence compared to the homogeneous model. The red dot represents assumed carriage durations of each carrier type for the initial analysis.