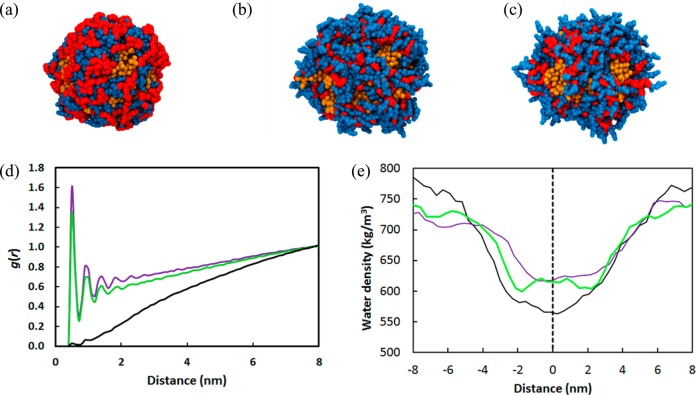
Figure 11.
Comparison of PTX loaded micelle cores formed by (a) hydrophobic (b) amphiphilic and (c) hydrophilic forms of cholic acid. The CA (blue) and LYS (red) groups encapsulating the PTX drug (orange) molecules are shown but the PEG shell is not shown for clarity. Plots of (d) radial distribution function of cholic acid with water, and (e) water density along the length of the simulation box for hydrophilic (purple line), amphiphilic (green line), and hydrophobic (black) CAs. The dashed line shows the center of the micelle.

