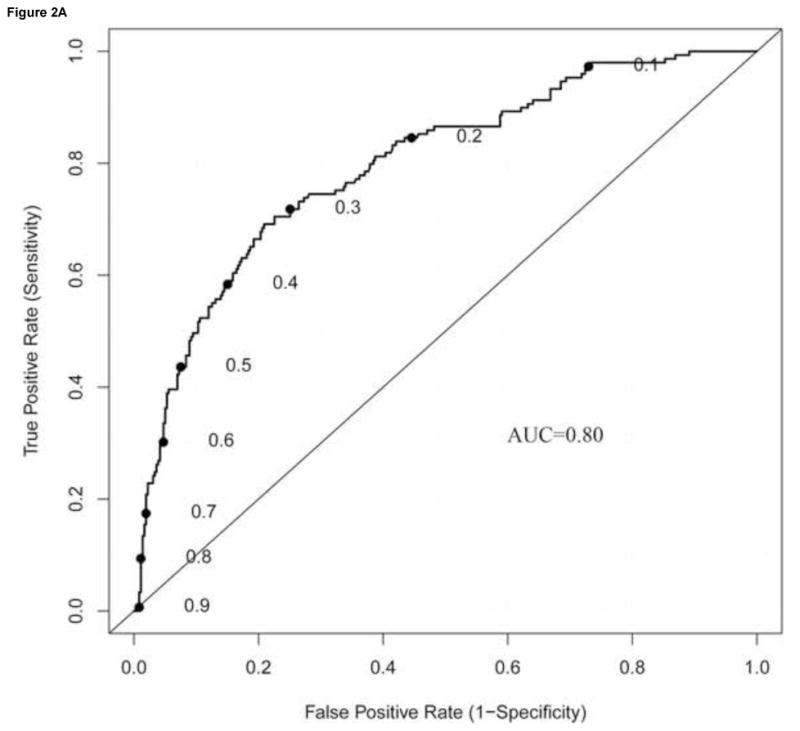
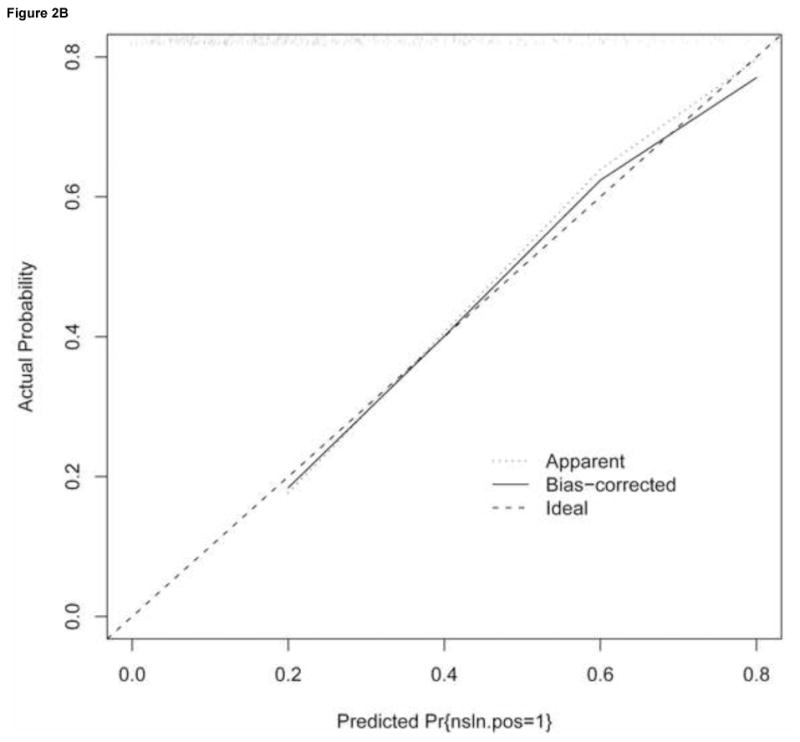
Figure 2. Validation of nomogram performance.


The performance of the nomogram was quantified with respect to (A) discrimination and (B) calibration. Discrimination was quantified with the area under the receiver operating characteristic (ROC) curve (AUC). To construct the calibration curve, a histogram of the probabilities calculated using the nomogram was plotted along the horizontal axis. The vertical axis represents the actual incidence on non-SLN positivity.
