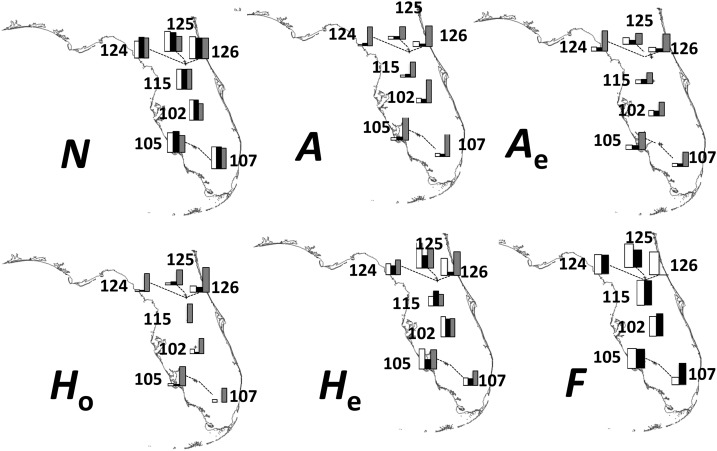
Fig. 2.
Geographical distribution of the genetic diversity of Polygala lewtonii. Different maps represent measures of diversity for the fragments (white bar), repeat number (black bar), and flanking regions (gray bar). N = number of individuals; A = number of alleles/number of polymorphic sites for sequence data; Ae = effective number of alleles/number of haplotypes; F = fixation index; He = expected heterozygosity; Ho = observed heterozygosity. Graphs are based on Appendix S6 (94KB, docx) .

