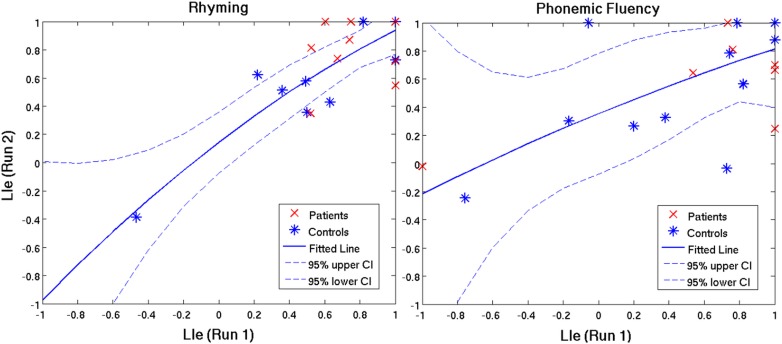
Fig 5. Test and re-test run correlations of LIe (laterality index characterized by the extent of activated brain volume) in patients (red) and controls (blue) for the rhyming task and phonemic fluency task.
The line of best fit and confidence interval (CI) pertain to the healthy control group (blue).

