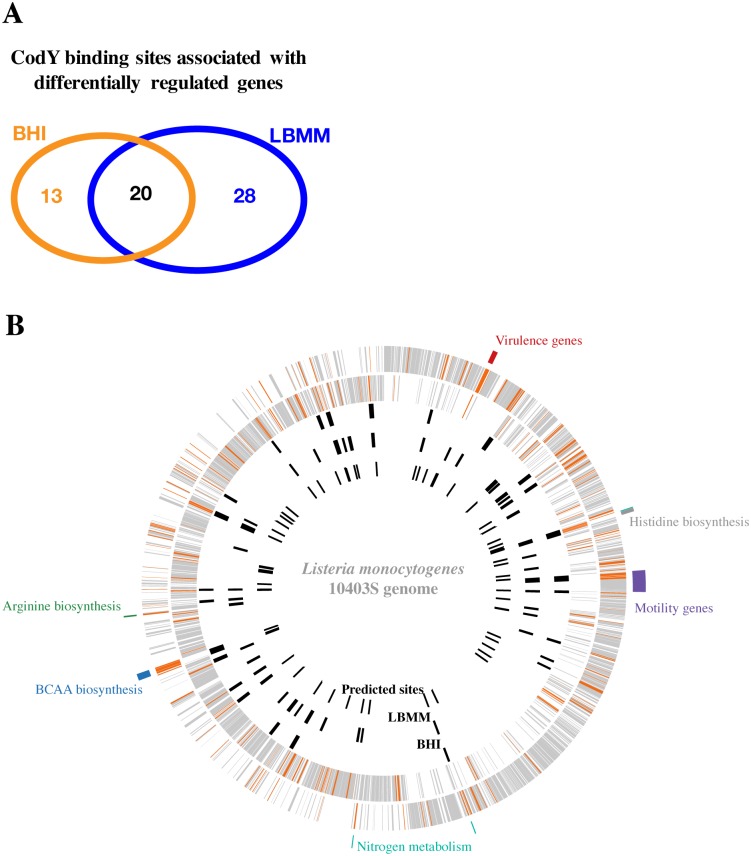
Fig 3. ChIP-seq analysis of CodY binding sites under growth in BHI and LBMM media.
A. Venn diagram representing CodY binding sites associated with differentially expressed genes in BHI and LBMM. B. Genomic view of CodY binding sites in L. monocytogenes 10403S– the two outer circles represent the + and—strands of L. monocytogenes genome, each line is a gene. Orange lines represent CodY regulated genes, while grey lines represent genes unaffected by CodY (based on the RNA-Seq analysis). The third circle represents CodY binding sites associated with differentially expressed genes in BHI medium, while the forth circle represents CodY binding sites associated with differentially expressed genes in LBMM. The fifth circle represents CodY motifs associated with differentially expressed genes, identified by the MAST algorithm [46] using a CodY binding consensus sequence as an input based on previous experimental CodY-box analyses [36, 37]. The consensus sequence was generated using the MEME algorithm [47]. Only sites with E value < 10 and P value < 0.05 are shown.

