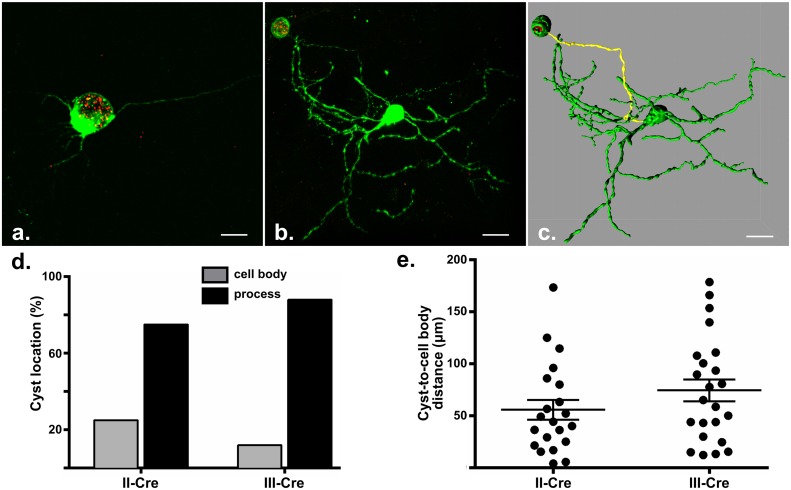
Fig 5. Toxoplasma cysts are primarily located in neuronal processes.
Cre reporter mice were infected with II-Cre or III-Cre parasites. At 3 weeks post infection, brains were harvested, sectioned into ~200 μm thick sections, processed to render the tissue optically clear, and then imaged at 40x on a confocal microscope. Resulting images were then analyzed with Imaris software to identify the cellular location of the cyst (neuronal process or cell body). For cysts within a process, imaging analysis software was used to determine the distance between the cyst and the cell body, along the infected process. (a) Representative maximal projection image of a cyst within a cell body. S1 Video shows a 3-D movie of this cell. (b) Representative maximal projection image of a cyst within a neuronal process. (c) Representative maximal projection image of (b) analyzed by Imaris to identify the whole neuron and to determine the length from the cyst edge to the edge of the cell body (yellow highlighted line). S2 Video shows a 3-D movie of this cell. Scale bars, 20 μm. (d) Quantification of the percentage of cysts found in the cell body or a neuronal process in mice infected with II-Cre or III-Cre parasites (as labelled). N = 26–28 cysts (III-Cre and II-Cre respectively). (e) Quantification of the distance between cysts and cell bodies for II-Cre and III-Cre cysts within neuronal processes. Cysts in the cell body (N = 7, II-Cre, N = 3, III-Cre) were excluded from this analysis. Each dot represents a single cyst-cell body measurement. Bars, mean ±SEM.

