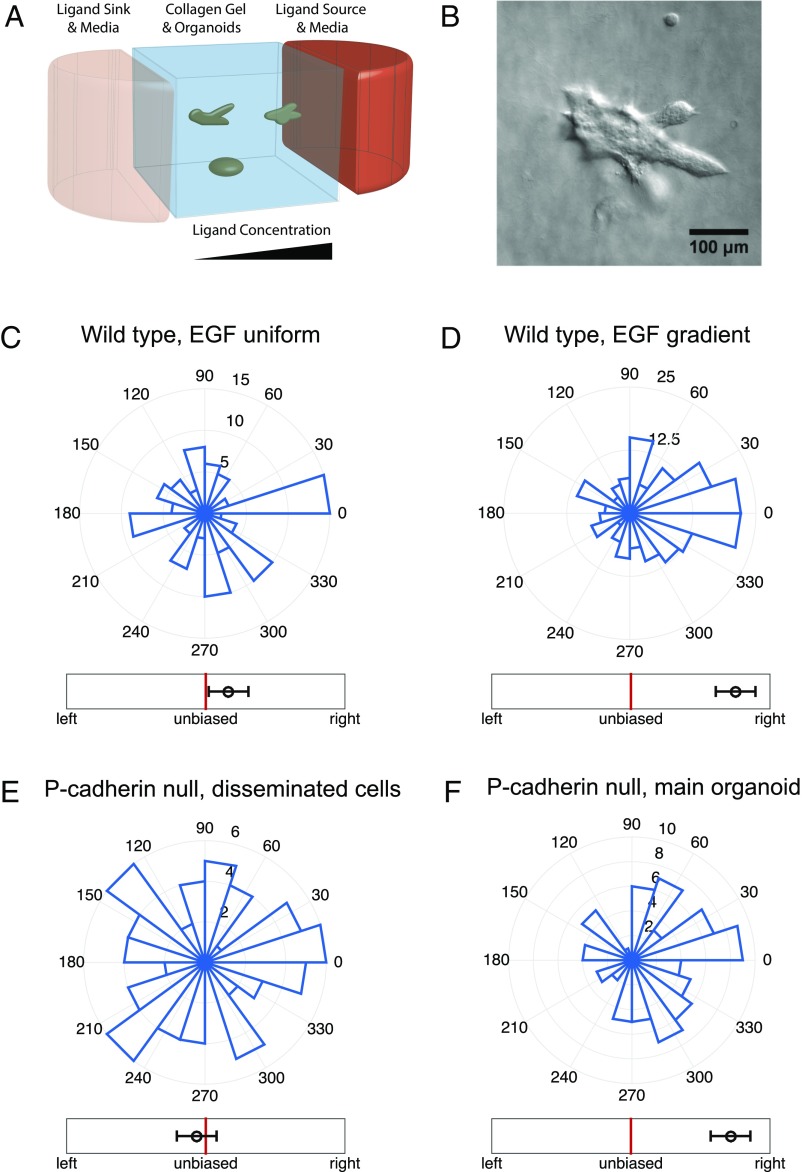
Fig. 1.
Organoid branching but not single-cell migration exhibits biased directional response to an EGF ligand gradient. (A) A schematic of the mesofluidic device chamber, with high (red) and low (pink) EGF concentration reservoirs and organoids embedded in a collagen gel exposed to the resulting EGF gradient (see Supporting Information for further information). (B) Example microscopy image of an organoid exposed to a 0.5-nM/mm EGF gradient, with preferential branch formation in the gradient direction (toward the right side of the field of view). (C–F) Angular histograms of (C) organoid branching directions in a uniform background of 2.5 nM EGF (three biological replicates, eight experimental replicates, total 110 organoids, total 460 branches), (D) organoid branching directions in a gradient of 0.5 nM/mm EGF (two biological replicates, two experimental replicates, total 200 organoids, total 1,283 branches), (E) in-gel migration directions of single cells separating from P-cadherin-deficient organoids in a gradient of 0.5 nM/mm EGF (two biological replicates, six experimental replicates, total 255 cells originating from 76 organoids), and (F) organoid branching directions for the P-cadherin organoids in a gradient of 0.5 nM/mm EGF (two biological replicates, six experimental replicates, total 79 organoids, total 394 branches). Whereas single cells do not exhibit biased movement, organoids exhibit biased branching. In C, D, and F, branching direction is defined as the angle of the vector sum of the organoid’s branches. The number of organoids branching in a specific direction is shown. In E, cell migration direction is defined as the angle of the vector sum of the displacements of all cells originating from a given organoid. In C–F, the circular axes measure the number of organoids with that branching direction, and left–right bias underneath each histogram is defined in Fig. 2 (measure B).

