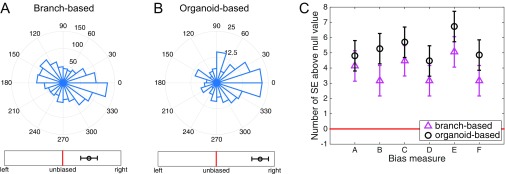
Fig. S3.
Bias determination is robust to choice of measure. All bias measures used in this study are shown, here for wild-type organoids in a 0.5-nM/mm EGF gradient. (A) Histogram of branch angles, irrespective of which organoid the branch comes from. (B) Histogram of organoid angles, defined as the angle of the vector sum of all branches coming from a given organoid. (C) Six bias measures, defined in Fig. 2 of the main text. Measure B is shown in A and B, Lower. In A–C, the response is significantly biased with respect to its SE.

