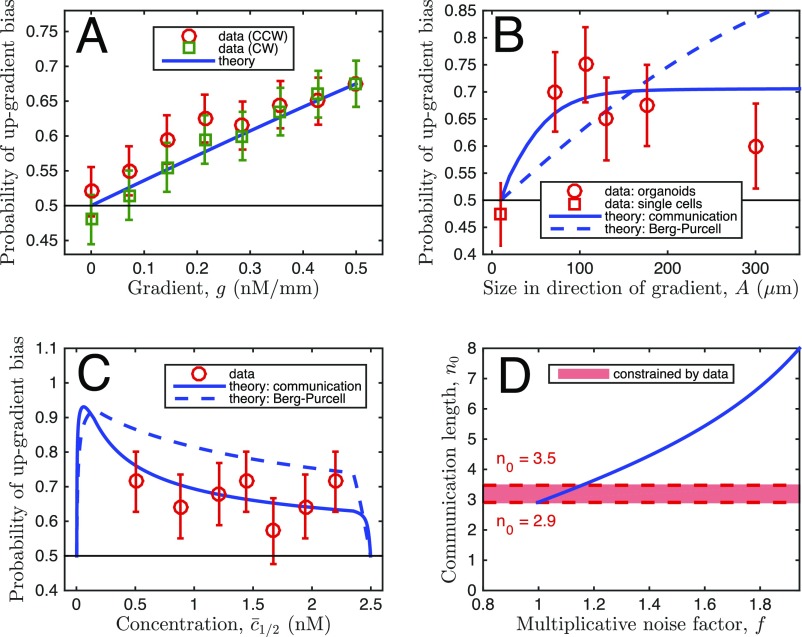
Fig. S7.
Comparison of data with theory, with multiplicative instead of additive noise. Plots are identical to Fig. 3 A–D of the main text, respectively, except that in the theory the downstream noise is multiplicative, instead of additive, as described here. Importantly, the conclusions, namely that the data support our theory with communication over BP theory (B and C), and our estimate for (here between 2.9 and 3.5) (D) are robust to the treatment of downstream noise.

