Fig. 3.
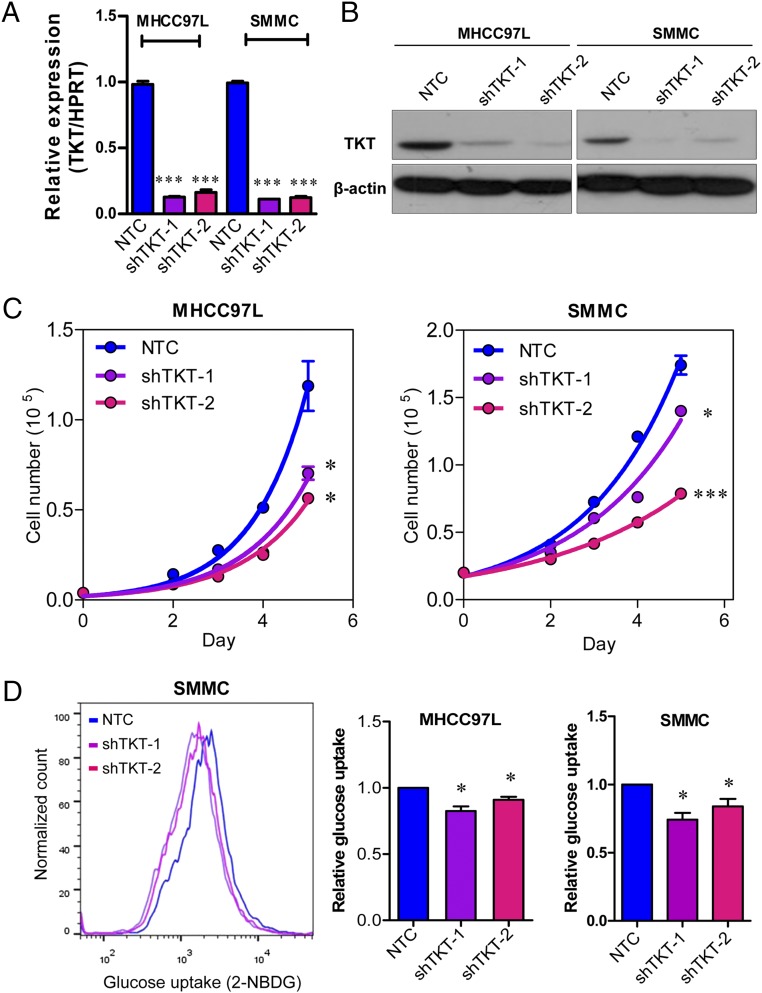
Knockdown of TKT reduced HCC cell proliferation and glucose uptake in vitro. (A) mRNA expression of TKT in MHCC97L and SMMC-NTC, –shTKT-1, and –shTKT-2 subclones. HPRT was used as the internal control. (B) Protein expression of TKT in MHCC97L and SMMC-NTC, –shTKT-1, and –shTKT-2 subclones. β-actin was used as the loading control. (C) Cell proliferation assay in MHCC97L and SMMC-NTC, –shTKT-1, and –shTKT-2 subclones. (D) Glucose uptake assay was performed in MHCC97L and SMMC-NTC, –shTKT-1, and –shTKT-2 subclones. (Left) Representative flow cytometry analysis showing intensities of 2-NBDG in the indicated HCC subclones. (Right) Histograms summarize the 2-NBDG intensities (glucose uptake) in different HCC subclones. Relative values were calculated based on the according NTC subclones. *P < 0.05, ***P < 0.001 versus NTC. A, C, and D, Student’s t test. Data are presented as means ± SD.

