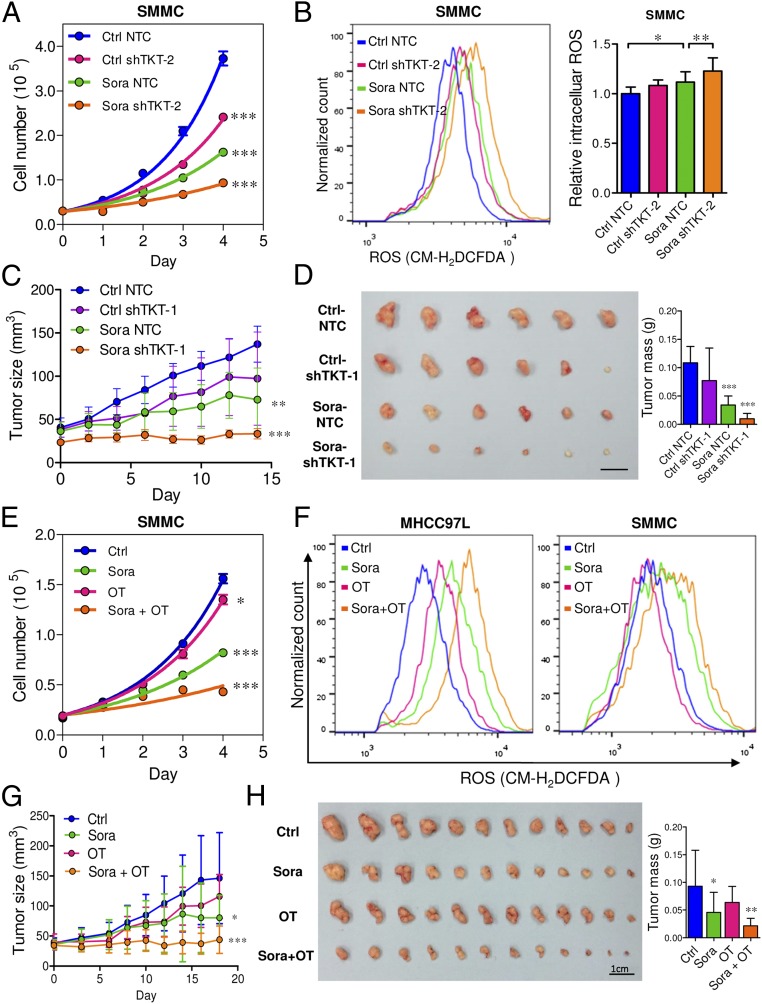
Fig. 7.
Genetic knockdown and pharmacological inhibition of TKT sensitized HCC cells to Sorafenib treatment via enhancing oxidative stress. (A) Proliferation curves of SMMC-NTC and –shTKT-2 cells in the presence of vehicle DMSO (Ctrl) or 6 μM Sorafenib (Sora). (B) Representative flow cytometry histogram (Left) and quantification (Right) of ROS staining in SMMC-NTC and –shTKT-2 cells treated with vehicle (Ctrl) or 6 μM Sora for 24 h. (C and D) Growth curves of s.c. xenografts derived from SMMC-NTC or –shTKT-1 cells in nude mice that were administered the control vehicle (Ctrl) or 30 mg/kg/d Sora for 14 d. (D, Left) Representative picture of tumor xenografts. (Right) Quantification of tumor mass (n = 6). (Scale bar, 1 cm.) (E) Proliferation curves of SMMC cells treated with vehicles, 6 μM Sora, 5 mM OT, or 6 μM Sora and 5 mM OT (Sora + OT). (F) Representative flow cytometry histograms of ROS staining in MHCC97L (Left) and SMMC (Right) cells treated with vehicles, 6 μM Sora, 5 mM OT, or 6 μM Sora and 5 mM OT (Sora + OT) for 24 h. (G) Growth curves of s.c. xenografts derived from parental SMMC cells in mice that were administered the vehicles (Ctrl), 30 mg/kg/d Sora, 80 mg/kg/d OT, or 30 mg/kg/d Sora and 80 mg/kg/d OT (Sora + OT) for 18 d. (H, Left) Representative pictures of tumor xenografts. (Right) Quantification of tumor mass (n = 12). (Scale bar, 1 cm.) *P < 0.05, **P < 0.01, ***P < 0.001 versus Ctrl. Student’s t test. Data are presented as means ± SD.

