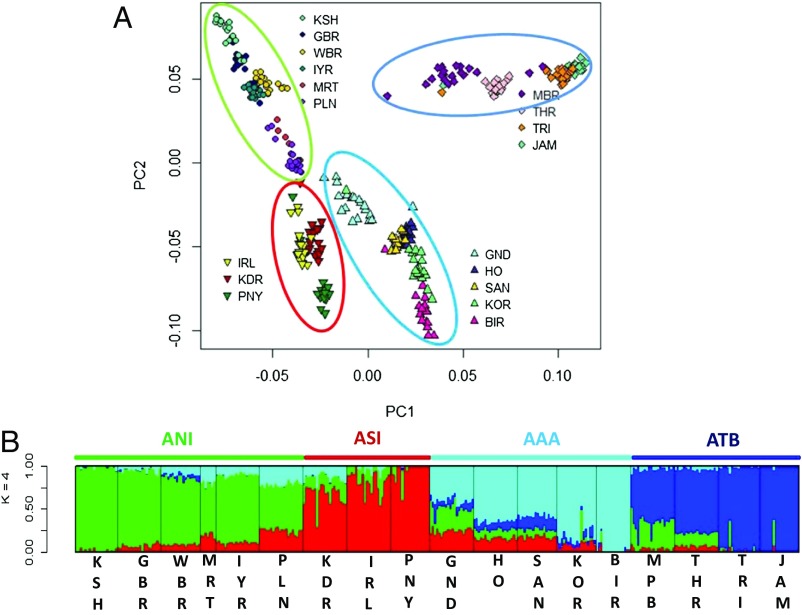
Fig. 2.
(A) Scatterplot of 331 individuals from 18 mainland Indian populations by the first two PCs extracted from genome-wide genotype data. Four distinct clines and clusters were noted; these are encircled using four colors. (B) Estimates of ancestral components of 331 individuals from 18 mainland Indian populations. A model with four ancestral components (K = 4) was the most parsimonious to explain the variation and similarities of the genome-wide genotype data on the 331 individuals. Each individual is represented by a vertical line partitioned into colored segments whose lengths are proportional to the contributions of the ancestral components to the genome of the individual. Population labels were added only after each individual’s ancestry had been estimated. We have used green and red to represent ANI and ASI ancestries; and cyan and blue with the inferred AAA and ATB ancestries. These colors correspond to the colors used to encircle clusters of individuals in A. (Also see SI Appendix, Figs. S2 and S3.)

