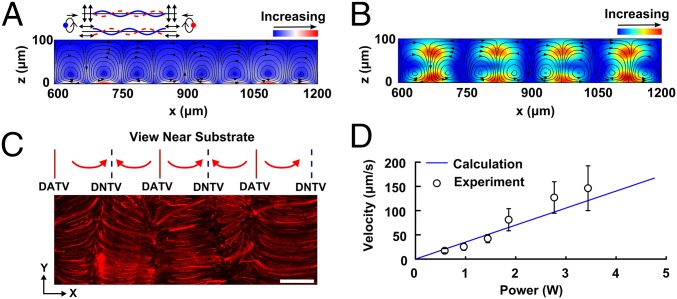
Fig. 3.
Study of acoustic streaming. (A) Simulation results showing the acoustic streaming patterns in the x-z plane, as induced by both the longitudinal and transverse vibrations. The streaming lines rotate clockwise or counterclockwise from a displacement node to two neighboring displacement antinodes. The arrows indicate the rotation directions. The red color nearby the substrate surface indicate the high magnitudes of the streaming velocities, whereas the blue color shows low velocities. (B) Simulation results of the distribution of Gor’kov potential overlaid on top of the acoustic streaming results in the microfluidic chamber along the x-z plane. (C) Visualization of the acoustic streaming pattern along the periodic array of displacement nodes and antinodes and the overlapped experimental acoustic streaming lines along the x-y plane, under a standing surface acoustic wave. Path lines formed from 1-μm red fluorescent polystyrene particles as they flow up from the premarked displacement nodes and rotating as our simulations predicted. (D) Experimental results showing the dependence of the magnitudes of the streaming velocities on the input power. (Scale bar: 100 μm.)

