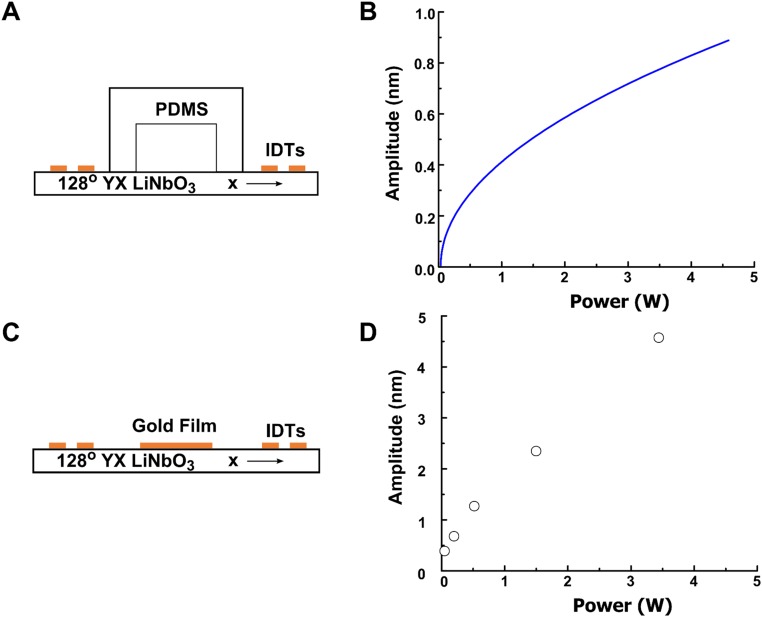
Fig. S2.
Calibration of vibration amplitude. (A) Schematic of the 1D SSAW microfluidic device. Two traveling waves are propagating toward each other and superposed to form a standing wave along the x axis of a 128° YX-cut lithium niobate substrate. Before entering into the microfluidic chamber, each wave propagates through a PDMS chamber wall which results in a decay of the vibration amplitude. (B) The curve shows the calibrated dependence of the amplitude of the LSAW (in the fluidic chamber) on the input power. (C) The figure illustrates the setup for directly measuring the amplitude of the longitudinal vibration of the SSAW. An additional 4 × 4 mm gold film with a thickness of 200 nm was deposited in the middle of the pair of IDTs to reflect light during the optical measurement. (D) The results graph the amplitude of the longitudinal vibrations under different input powers by directly measuring the SAW vibrations on the substrate with an optical vibrometer system.

