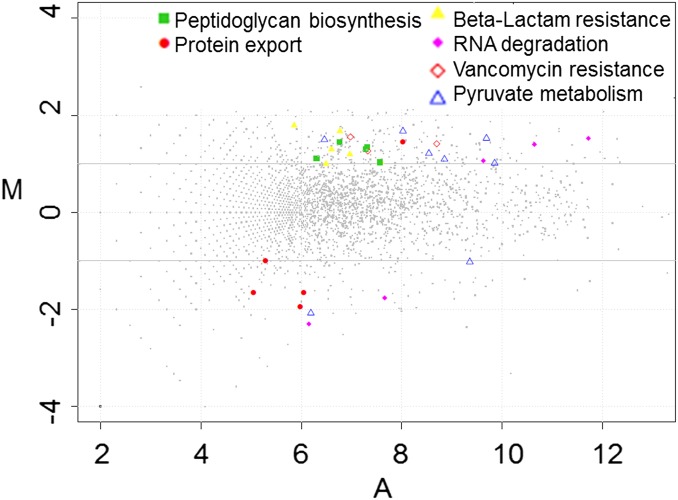
Fig. 1.
RNA-seq analysis of genes that are regulated by VbrK. MA plots of relative transcript abundance between WT and ∆vbrK. The log2 of the ratio of abundances of each transcript between the two strains (M in y axis) is plotted against the average log2 of abundance of that transcript in both strains (A in x axis).

