Fig. 1.
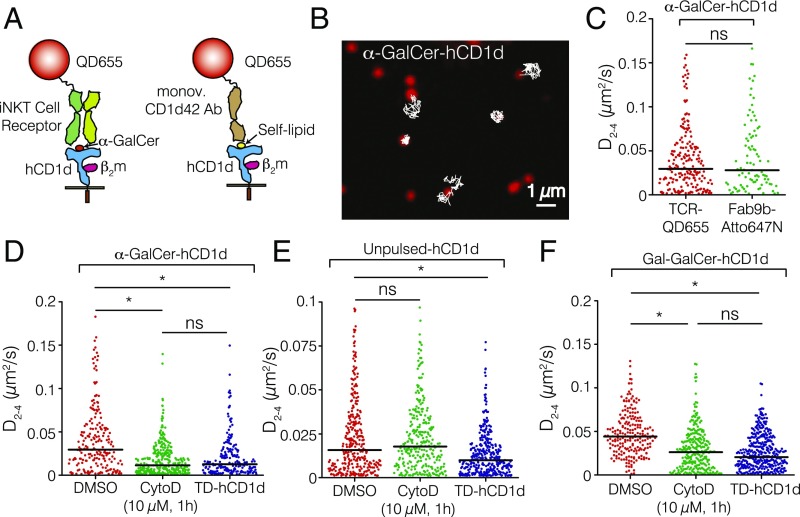
The actin cytoskeleton affects the mobility of hCD1d molecules on the surface of APCs. (A) Schematic illustration of the labeling procedure. (Left) α-GalCer–loaded hCD1d molecules (blue) were labeled using a conjugate of an iNKT-TCR (light and dark green) and a QD (red). (Right) Unpulsed hCD1d molecules were labeled using a monovalent anti-CD1d42 Ab conjugated to a QD. Not to scale. (B) Selected TIRFM image of the ventral side of an α-GalCer–pulsed THP-1 cell displaying individual iNKT-TCR-QD–labeled hCD1d molecules (red) on the cell membrane. Representative 2D trajectories (white) are overlaid on the raw image (frame rate =100 Hz). (C) Distributions of the D2–4 values of α-GalCer–loaded hCD1d labeled with the iNKT-TCR-QD conjugate or Fab9b-Atto647N. (D–F) Distributions of the D2–4 values for (D) α-GalCer–pulsed, (E) unpulsed, and (F) Gal-GalCer–loaded hCD1d THP-1 cells treated with 10 µM CytoD or expressing TD-hCD1d mutant molecules. Note that the comparisons of D2–4 values are always made with respect to the basal situation (DMSO) and specifically, for each lipid-loaded condition, because the basal diffusion of hCD1d depends on the lipid. Data are representative of typically 200 trajectories per condition (90 trajectories in the case of hCD1d labeled with Fab9b-Atto647N) from at least 25 cells over eight different experiments. ns, Not significant (P > 0.05; one-way ANOVA test). *P < 0.0001 (one-way ANOVA test).

