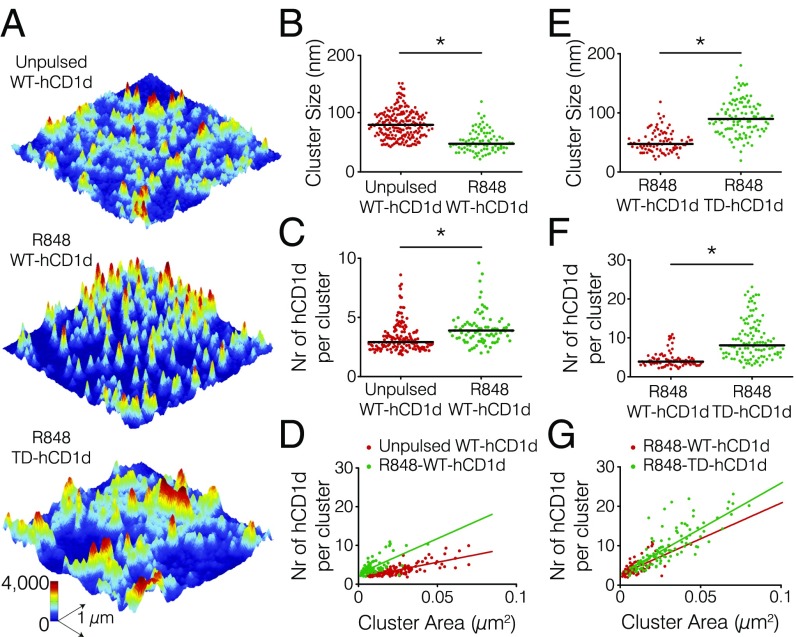
Fig. 6.
The actin cytoskeleton regulates hDC1d nanoclustering under inflammatory conditions. (A) STED images of (Top) unpulsed WT-hCD1d, (Middle) R848-WT-hCD1d, and (Bottom) R848-TD-hCD1d on the dorsal cell membrane of THP-1 cells stretched on poly-l-lysine–coated glass coverslips. (B and E) Distributions of cluster size, (C and F) distribution of the number (Nr) of hCD1d molecules per cluster, and (D and G) scatterplots of the number (Nr) of hCD1d molecules per cluster vs. cluster area corresponding to the quantification of the STED images. STED nanoscopy analysis data from at least 30 different images of 3 × 3 μm in size from at least two different experiments. Horizontal bars correspond to median values. *P < 0.0001 (one-way ANOVA test).

