Fig. S3.
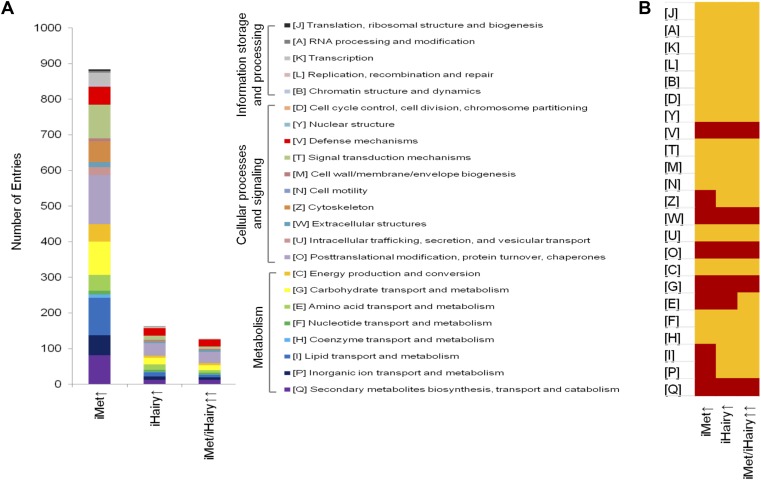
(A) Ontology analysis of gene cohorts differentially expressed in the female fat body after RNAi depletion of Met and Hairy. Three major categories and the functional groups with corresponding abbreviations and colors are indicated. (B) The OGs with significant overrepresentation (P < 0.01 in a hypergeometric distribution) are marked in red. The abbreviations used are same as that of A.

