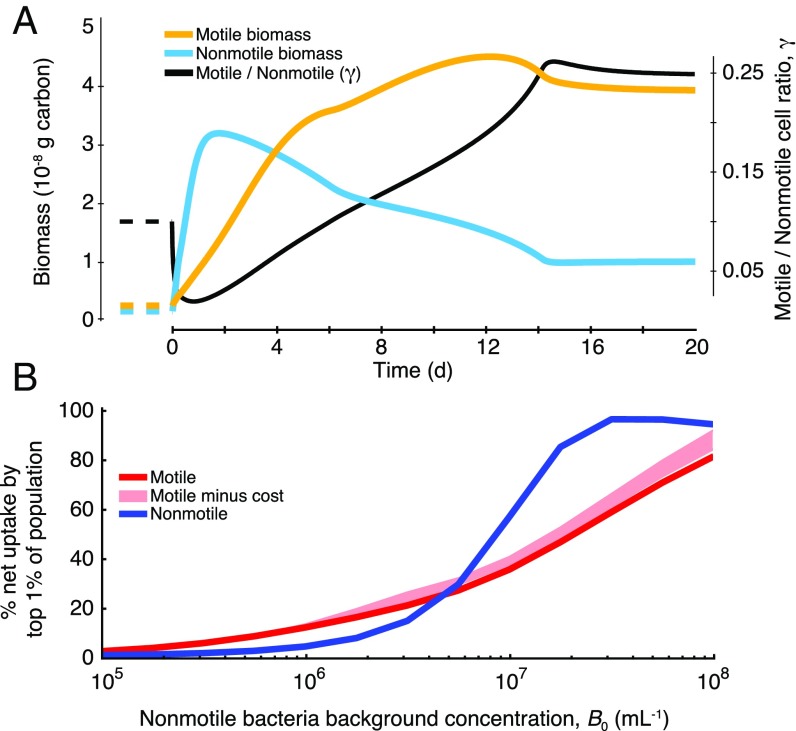
Fig. 5.
Bacterial growth during a phytoplankton bloom, illustrating the effects of phycospheres on the initiation of succession among populations of bacteria. (A) Biomass of motile (yellow) and nonmotile (cyan) cells and motile:nonmotile cell number ratio γ (black). The bloom was simulated by exposing both populations over several days to a constant lysis encounter rate of 10 per d. Before bloom initiation (dashed lines), conditions for the bacteria populations were set at γ = 0.1, nonmotile background bacterial concentration B0 = 5 × 10⁵ cells per mL, and cell sizes aM = 0.5 μm and aNM = 0.2 μm. (B) Contribution by the top 1% of cells to the overall population consumption of DOM by each population. For B, results are for 1-d exposure to a bloom where B0 was fixed (accordingly) and γ = 0.1, and shaded pink areas indicate motile population benefits after subtracting costs for swimming (Fig. 4).

