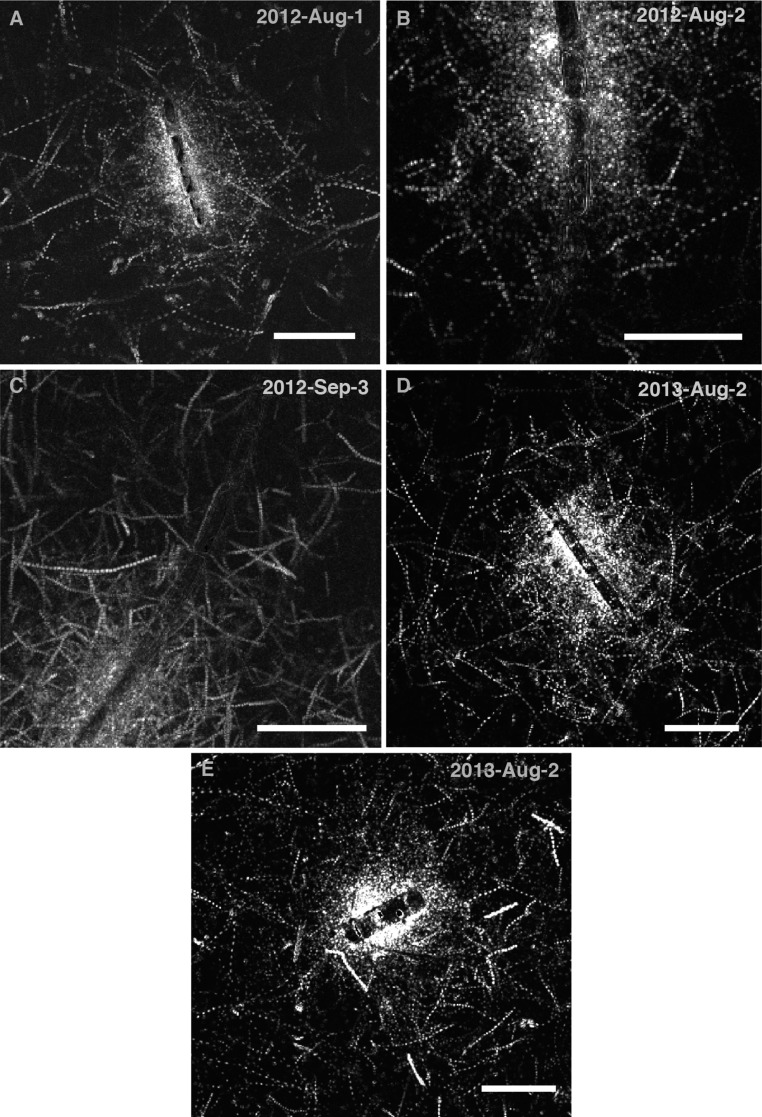
Fig. S3.
(A–E) Chemotactic clusters around different chains of C. affinis undergoing lysis, captured on different days with different bacterial communities enriched from coastal seawater, demonstrating experimental replication of the dynamics shown in Fig. 1D and Fig. S4. Shown are bacterial swimming trajectories captured over 1–2 s at a time close to peak cell accumulation. (Scale bars, 50 μm for all images.)

