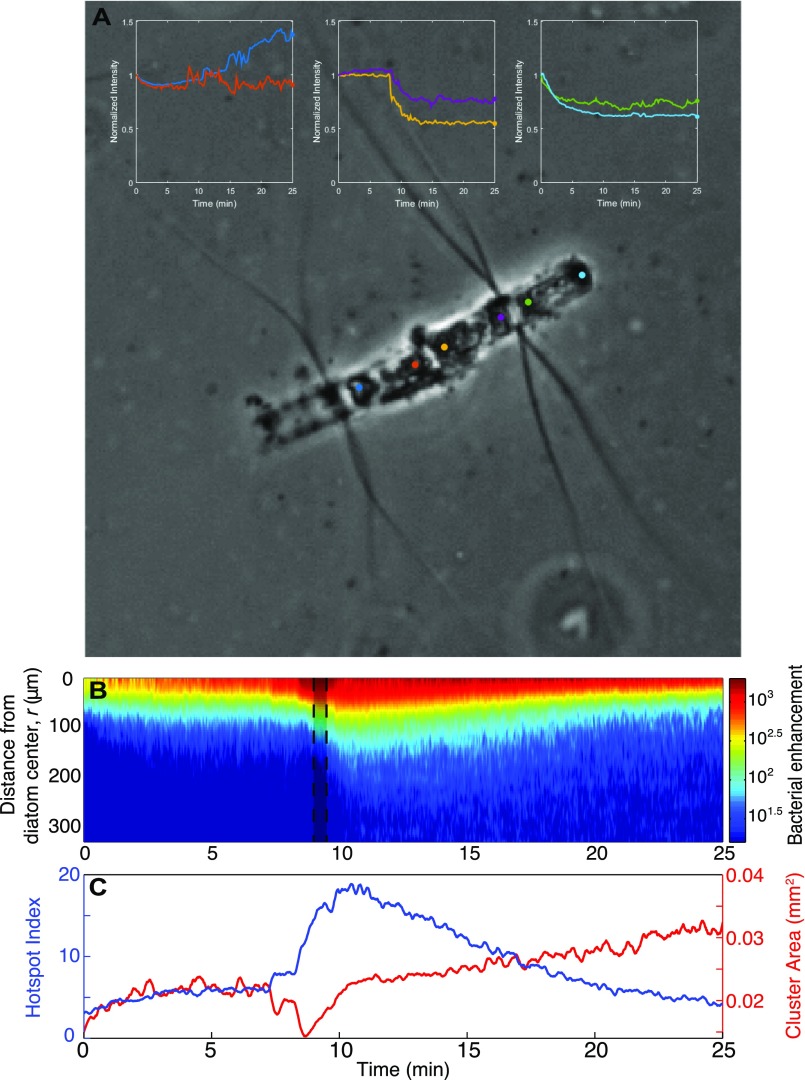
Fig. S4.
Diatom chain lysis and the quantified bacterial response. (A) The color-coded profiles demonstrate the changing brightness (normalized by initial value) of points at each end of diatom cells corresponding to Fig. 1D. The sudden change in intensity at one end of the middle cell at 7 min indicates the point at which a sharp lysis event occurred. In contrast, the more gradual change in the left and right cells points to gradual changes in the diatom structure and a more prolonged DOM leakage. (B) Bacterial enhancement relative to the background concentration, B(r,t), as a function of distance from the diatom center, r, and time, t. The shaded region at t = 9 min corresponds to the section of the movie depicted in Fig. 1D. (C) Two metrics characterizing the cluster dynamics: the hotspot index, H, measures the mean motile cell concentration near the diatom (r < 100 μm) relative to the mean background concentration, and the cluster area represents the area of the 2D region where the bacterial concentration was greater than 0.5H.

