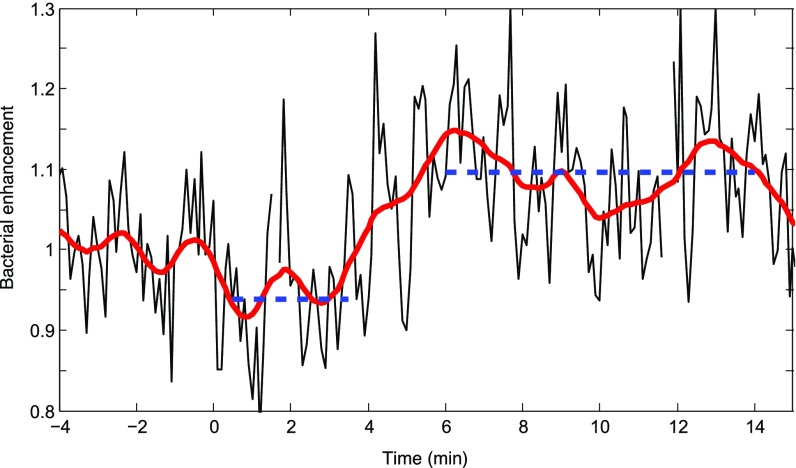
Fig. S6.
The phycosphere extends to ∼2 mm, as seen in a higher-resolution view of data displayed in Fig. 2A. Diatom lysis occurred at t = 0. The black line shows the average cell concentration every 6 s, as the fold difference normalized by the average concentration before lysis (−4 min to −40 s), for the region contained between r = 1.2 and r = 1.8 mm from the diatom center. The concentration initially decreased from 0.5 to 3.5 min after lysis (one-sided t test, P < 0.001) then increased significantly from 6 to 14 min after diatom lysis (one-sided t test, P < 0.001). This corresponds to an initial loss of 103 cells, and a subsequent gain of 2.5 × 10³ cells, in the volume that comprises this region. The red line is a running mean with 1-min averaging window.

