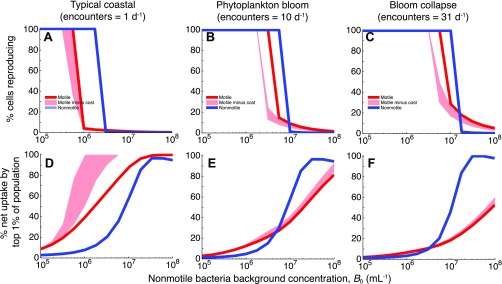
Fig. S10.
Percentage of cells reproducing within a population (A–C) and contribution to DOM consumption by the top 1% of cells in a population (D–F), for a motile population (red), a nonmotile population (blue), and a motile population for which swimming costs have been accounted (pink shading). Results are shown for three assumed diatom lysis encounter rates, corresponding to typical coastal conditions (A and D), a phytoplankton bloom (B and E), and a bloom collapse (C and F). ‟Reproducing cells” were those that consumed more than one new cell carbon equivalent over 1 d. For all panels the ratio of motile to nonmotile cells in the total population was γ = 0.1. Costs of motility were computed as the envelope of results obtained for a range of swimming velocities (40–60 μm/s) and swimming efficiencies (1–2%) (SI Materials and Methods).

