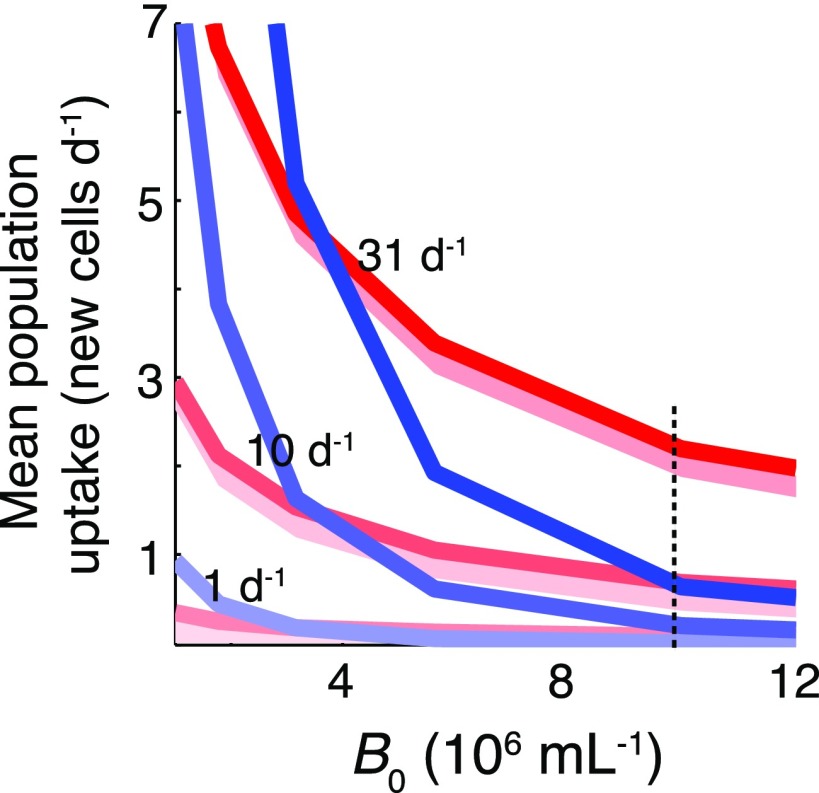
Fig. S11.
Bacterial growth comparison under different phycoscapes. This is a direct comparison of motile copiotrophs (red) and nonmotile oligotrophs (blue) plotted in Fig. 4, but with linear axes. The advantage for motile cells (i.e., the ratio of motile to nonmotile uptake expressed as a percentage for each encounter rate) when B0 = 107 cells per mL (indicated by a dashed line) is <40% for typical coastal conditions (lysis encounter rate of 1 per d), 190–310% for a phytoplankton bloom (10 per d), and 300–340% for a bloom collapse (31 per d).

