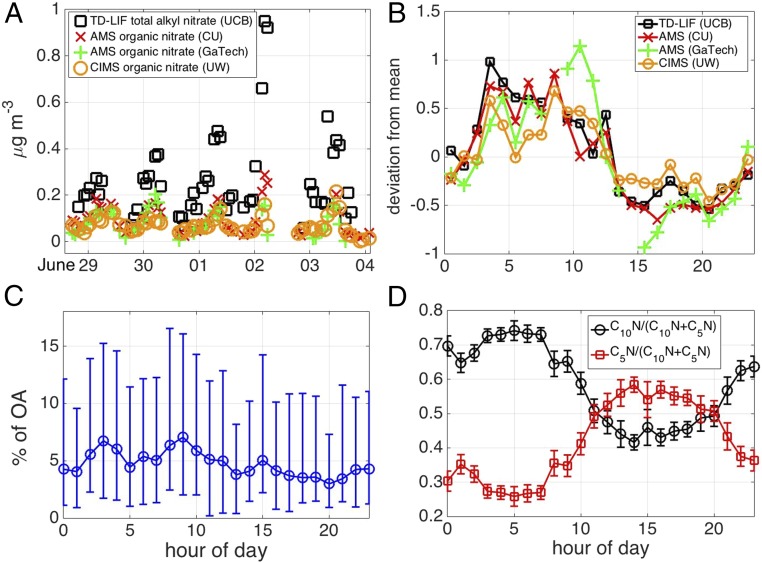
Fig. 1.
(A) Subset of the time series of total pON as measured by two HRToF-AMSs, the FIGAERO HRToF-CIMS, and the TD-LIF during the SOAS. (B) Deviation of each technique from their respective campaign means plotted as a function of time of day. Because of the sparse data overlap between the four techniques, we include data for all periods when there is overlap with the UW data. (C) Median contribution of the pON—accounting for their identified molecular masses—to measured OA plotted as a function of day. The lower and upper error bars represent 25th and 75th percentiles, respectively, of the observed atmospheric variability (systematic errors are discussed in the text). (D) Fractions of the C5 (red) and C10 (black) ON groups contributions relative to their sums plotted as a function of time of day. CU, University of Colorado Boulder; GaTech, Georgia Institute of Technology; UCB, University of California, Berkeley; UW, University of Washington.

