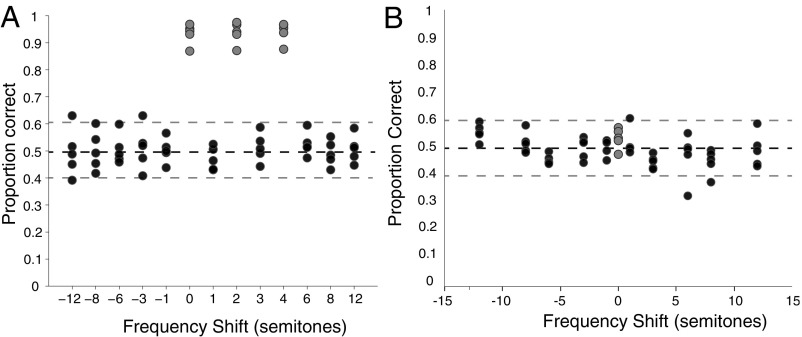
Fig. 2.
Pitch and timbre results. (A) Mean proportion of correct responses to tone sequences with novel pitches but familiar timbre. The x axis shows pitch shift (in semitones) relative to the lowest frequency training stimulus. Gray circles show recognition of the original training sequences during test sessions. Each point shows the data for one subject. (B) Performance as in A but for sequences composed of sounds with a novel (piano) timbre at the training pitches (gray) or shifted in pitch (black). Dashed lines indicate Bonferroni-corrected 95% CI around chance (50%).

