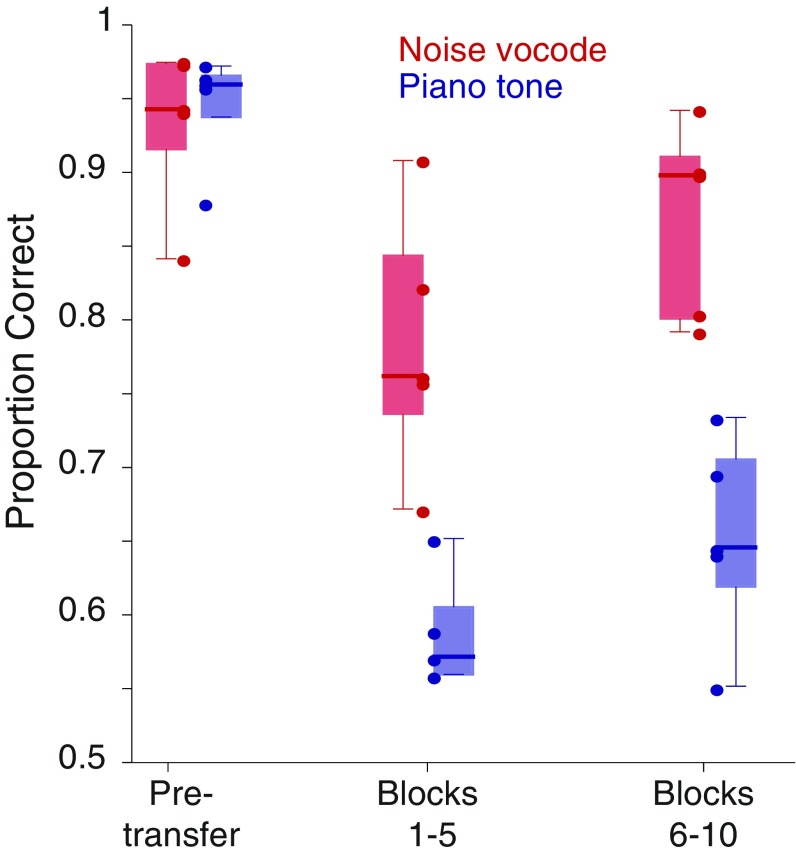
Fig. 3.
Comparison of transfer to noise-vocoded versus piano-tone sequences. Box plots showing the proportions of correct responses averaged over the first and second sets of 100-trial blocks during the transfer to the noise-vocoded (red) and piano-tone (blue) stimuli. Performance over the 500 trials just before each transfer is also given. Circles show the data for each subject in each condition. A similar analysis based on 50-trial blocks shows the same effects.

