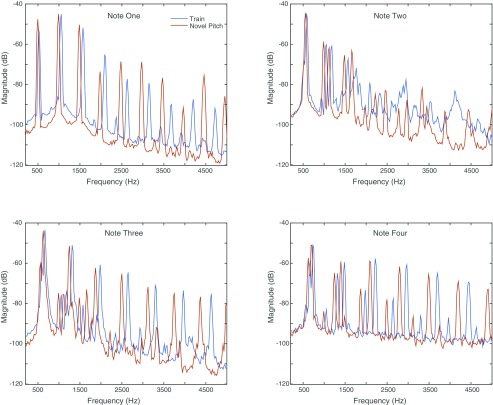
Fig. S3.
Example comparisons of the overall absolute spectral shape for notes in the training and novel pitch test sounds. Each panel shows the frequency spectra for one of the four notes (blue lines) in a training stimulus (Fig. S1B) and the corresponding notes (red lines) in a novel pitch stimulus (Fig. S1E) that is one semitone lower.

