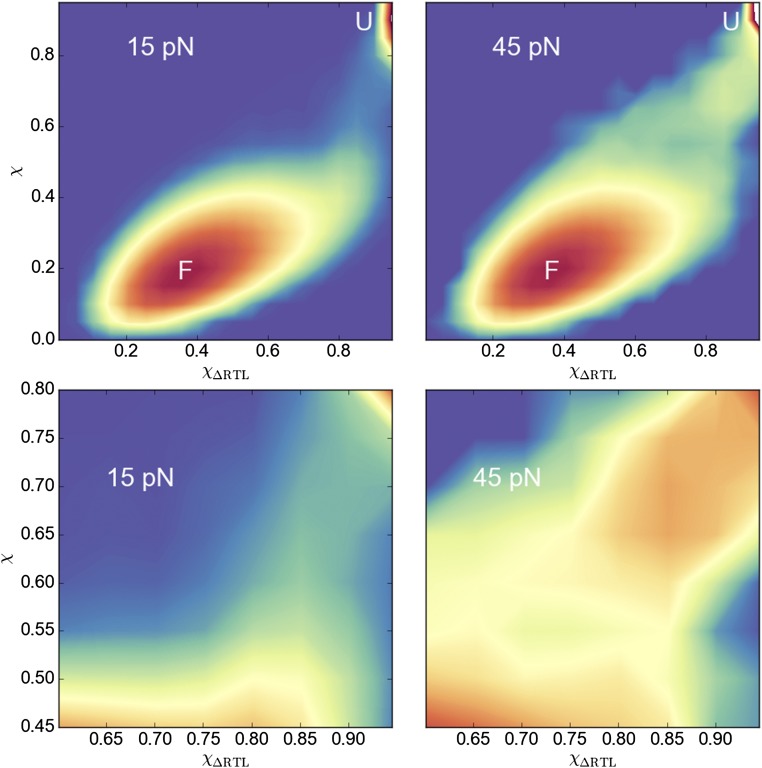
Fig. 3.
Histograms of unfolding trajectories at 15 and 45 pN show the difference between unfolding pathways. The overlap parameter χ is the order parameter describing the global unfolding, and shows ruptured interactions between the RT loop and the core. The lower panels are blowups of the route to the unfolded (U) state, whereas the upper panels show the profiles connecting F and U states (color scheme is also adapted to higher resolution). The forces are explicitly marked. The rupture process of the RT loop is dramatically different at 15 pN and 45 pN, demonstrating a switch in the unfolding pathway.

