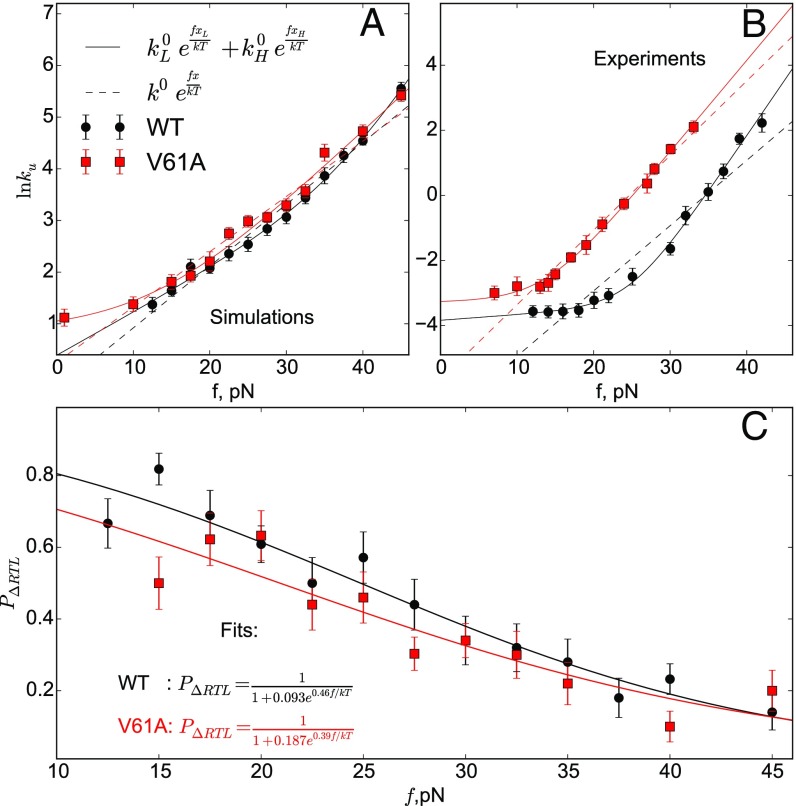
Fig. 6.
(A) Unfolding rate for the V61A mutant obtained using simulations shows the single-exponential model to be more probable than the double-exponential fit. (B) Same as A except the data are from experiments. (C) Fraction of trajectories that unfold through the low-force pathway as a function of f obtained directly from simulations. Lines are the fits to the function with parameter values as indicated.

