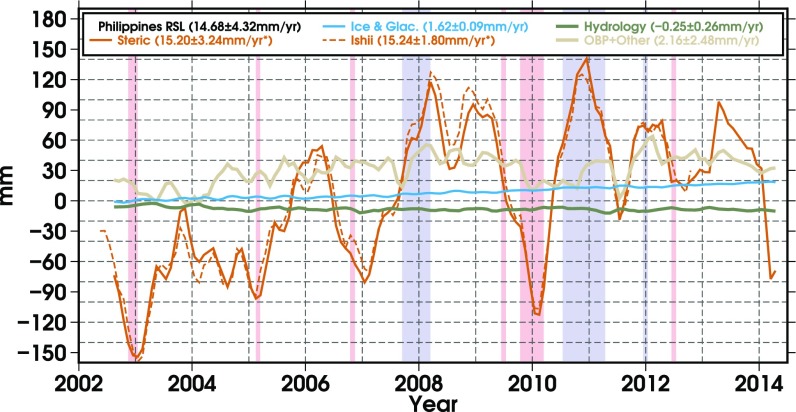
Fig. 3.
Time-variable sea-level contributions to the east of the Philippines. Warm (El Niño, red) and cold (La Niña, blue) phases are highlighted whenever the MEI gets larger than 1 or smaller than −1, respectively. The asterisk indicates that the trend is computed over the period where there are Ishii data available (2002–2012). Plots of other regions can be found in the SI Appendix.

