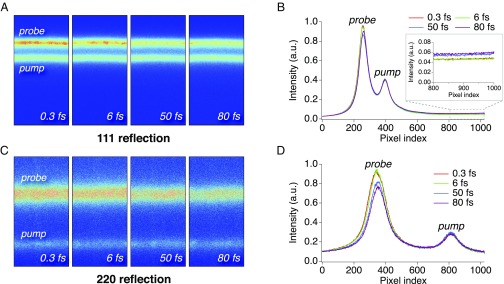
Fig. 2.
Images and line profiles of the diffraction from diamond. (A and C) MPCCD images of the 111- and 220 reflections at time intervals between the pump and the probe pulses of 0.3, 0.6, 50, and 80 fs, which are averaged over multiple shots with specific fluences of the pump [(3.1 ± 0.2) 104 J cm−2] and the probe [(6.9 ± 1.1) 104 J cm−2] pulses. (B and D) Line profiles of A and C after compensating for the effect of XFEL polarization on the diffraction intensity (Materials and Methods). (B, Inset) An enlarged figure that represents diffuse scattering around the 111 reflection.

