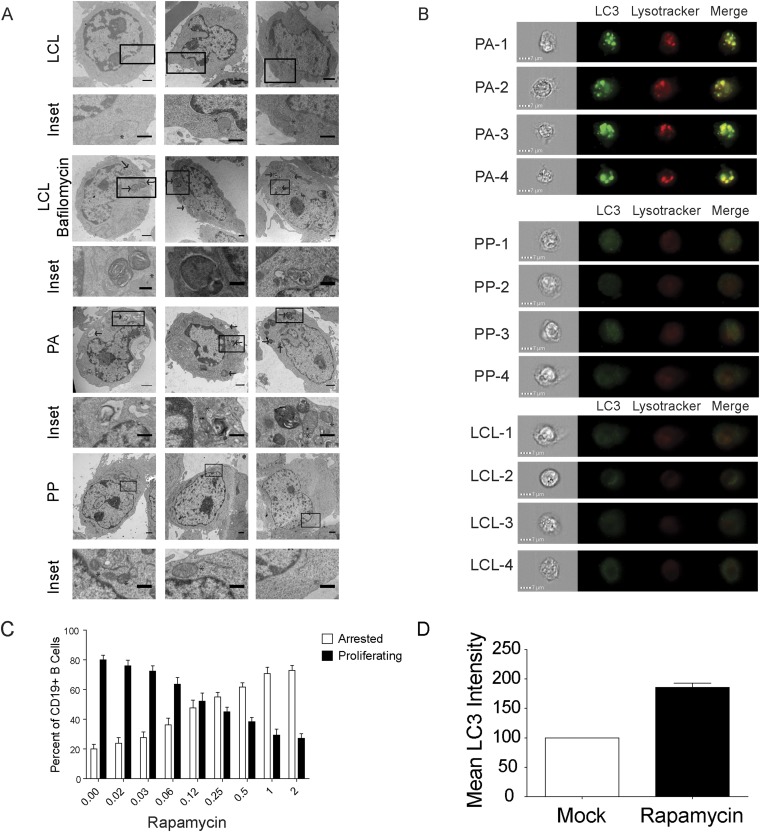
Fig. S2.
The PA cells exhibit suppression of the mTOR pathway and increased autophagy. (A) Representative TEM images of sorted PA and PP cells as well as negative control LCLs and positive control serum starved and bafilomycin-treated LCLs. Arrows indicate autolysosomes and/or phagosomes (n = 2). (Magnification ranges from 3,400× to 11,500×.) (Scale bar: 1 μm; Inset, 0.5 μm.) (B) Imagestream analysis of PA, PP, and LCLs that were stained with Lysotracker and anti-LC3. (C) Percent of cells that arrest after treatment with the indicated dose of Rapamycin (n = 3). (D) Relative increase in LC3 mean fluorescence intensity in cells treated with 2 nM rapamycin or mock treated (n = 2). n, the number of independent donors tested.

