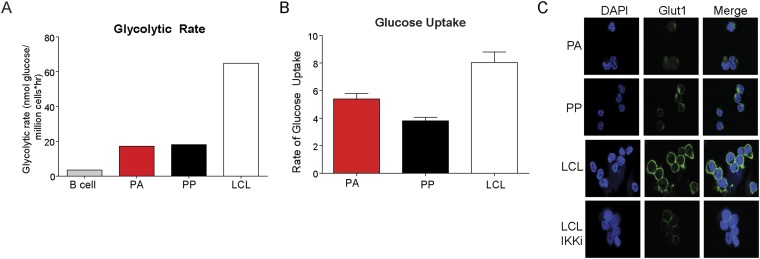
Fig. S3.
Metabolic profile reveals differences between uninfected B cells, PA, PP, or LCLs. (A) Glycolytic rate of uninfected B cells; CD19+, EBV-infected, sorted PA and PP cells, or LCLs. (B) Glucose uptake in PA, PP, or LCLs. Cells were starved in glucose-free medium for 1 h and then supplemented with 2-NBDG, a fluorescent glucose analog. (C) IF of DAPI (blue) or GLUT1 (green).

