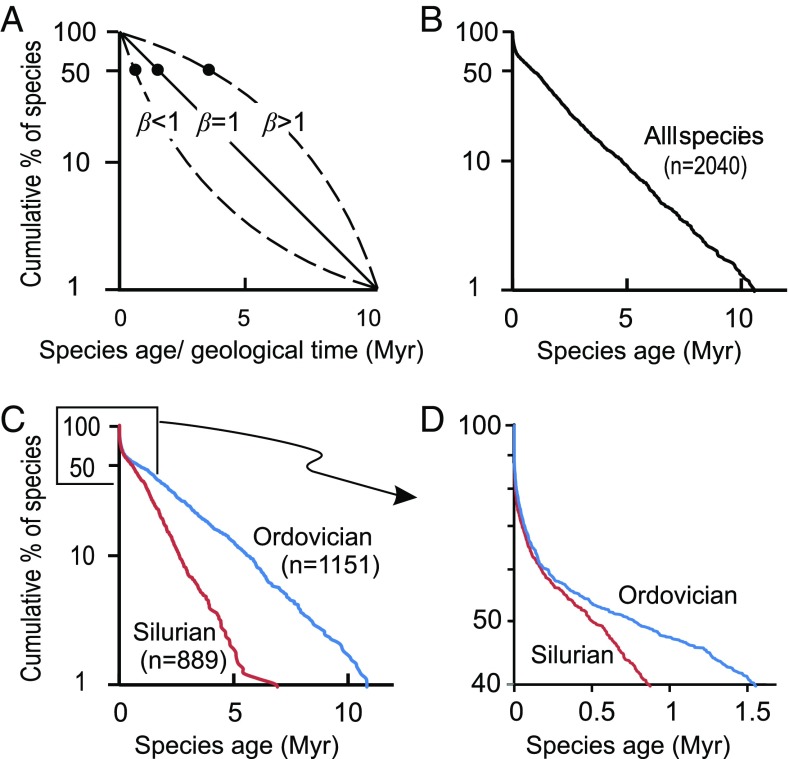
Fig. 1.
(A) Semilog plot showing idealized taxon survivorship curves for a cohort commencing at 0 My; β = 1, linear survivorship curve indicating exponential decay rate (constant extinction probability); β < 1, decreasing decay rate, extinction probability decreases with taxon age; β > 1, increasing decay rate, extinction probability increases with taxon age). Black dots indicate median cohort age in each curve. (B−D) General age structure curves for all species (B) and for all Ordovician and all Silurian species (C and, detail, D). The life expectancy of a Silurian species is half that of an Ordovician species.

