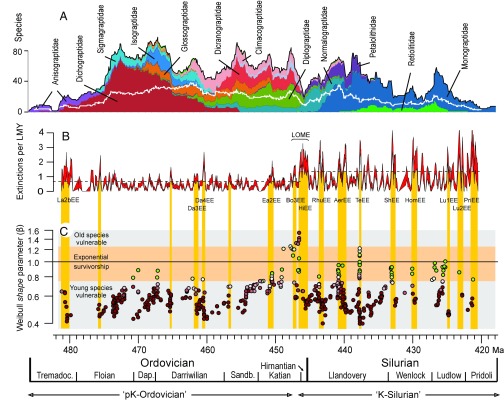
Fig. 2.
(A) Graptoloid standing species richness, main families shown. The white line is level-by-level generic richness. (B) Extinction rate (extinctions per lineage-million-years), 0.25-My moving window, centered at each level in the composite. The band represents ±1 SE from bootstrap means (1,000 iterations) of median values for each 0.25-My bin. The main extinction episodes, those exceeding the 75th percentile for each period (dashed lines) are: La2bEE, Lancefieldian 2; Da3EE, Darriwilian 3; Da4EE, Darriwilian 4; EaEE, Eastonian; BoEE, Bolindian; HiEE, Hirnantian; RhuEE, Rhuddanian; AerEE, Aeronian; ShEE, Sheinwoodian; HomEE, Homerian; Lu1EE, Ludfordian (early); Lu2EE, Ludfordian (late); and PriEE, Pridolian. (C) Weibull shape (β) value for each cohort survivorship curve is plotted at the median age, in geological time, of the last appearances of its constituent species. Red points, Weibull model preferred; green points, exponential model preferred; the darker the tone, the greater the AIC weight of the preferred model. Age bands with clusters of green points indicate fields with cohorts in which extinction is not dependent on species age; 498 points are shown.

