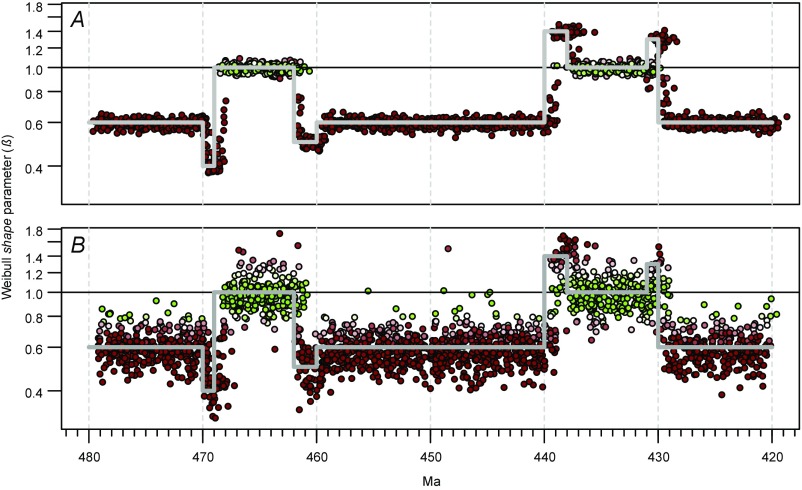
Fig. S4.
Tests of our model-fitting method using synthetic data sets. Time series of fitted Weibull shape parameters (β) based on entirely synthetic data. In both plots, the heavy gray line indicates the β that was used to generate the synthetic species ranges through different intervals of the time series; this parameter was perturbed within the range of values observed in the graptolite data. (A) Results based on a very large dataset of 100,000 species and a minimum of 100 species per cohort. (B) Results based on a dataset of 2,045 species and a minimum of 20 species per cohort—values that match our graptolite dataset—and five repetitions. See Fig. 2 for explanation of symbol colors, etc.

