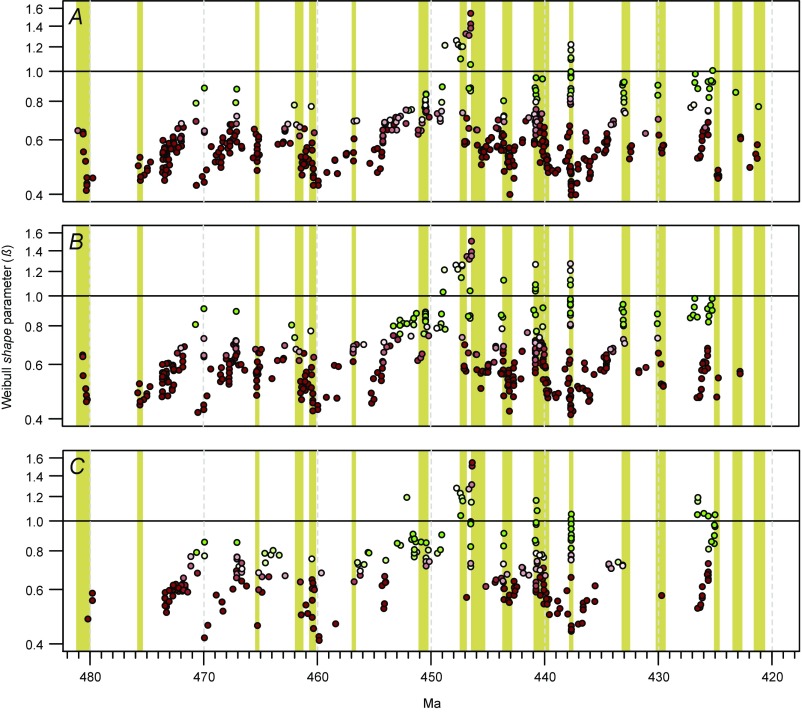
Fig. S7.
Test for the impact of pseudoextinction. Results of modeling following the elimination—by combining ranges of candidate ancestor−descendant pairs—of potential instances of pseudoextinction. (A) Result with no instances of pseudoextinction removed (compare Fig. 2). (B) Result following removal of 160 instances of potential pseudoextinction. (C) Result following removal of 654 instances (∼30% of species) of potential pseudoextinction. Yellow bars denote extinction episodes discussed in the main text. See Fig. 2 for explanation of symbol colors, etc.

