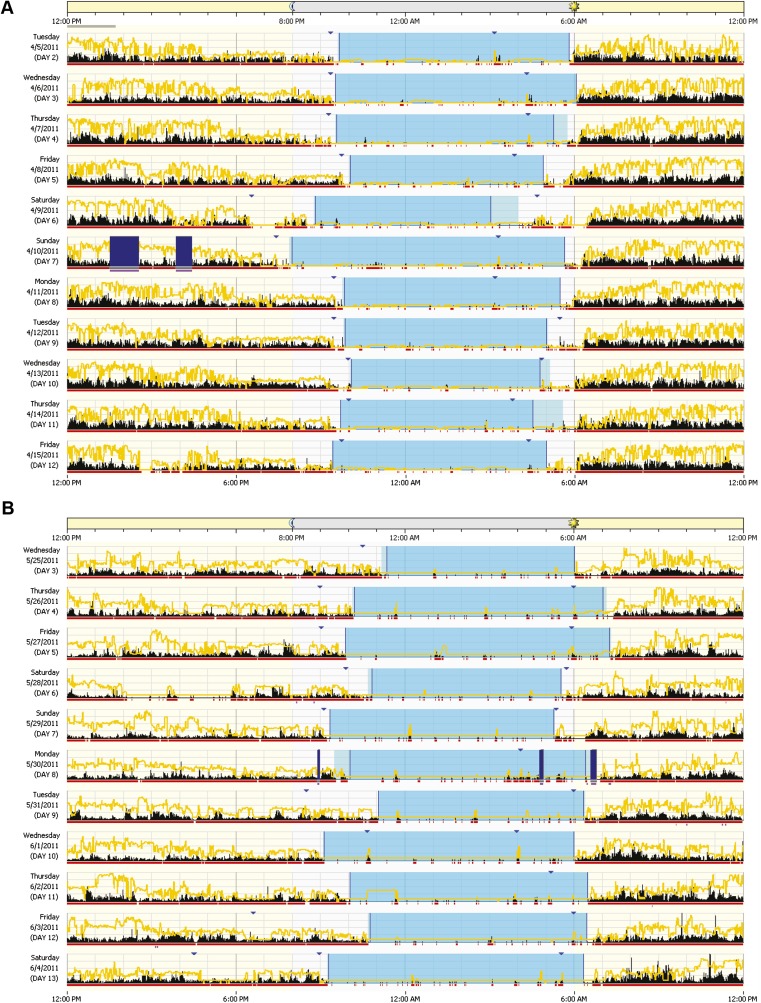
Fig. S1.
Example of actigraphies from one non–BP-I and one BP-I participant, from the same family. The activity level is indicated in black. The yellow line represents light levels. Dark blue bars indicate when the watch was off-wrist. Red squares below activity indicate the epochs that are scored as awake. Blue triangles indicate when the subject pressed the marker button (ideally at rest onset and rest offset). Light blue periods represent the rest period; darker light blue periods within the rest period indicate the sleep period. Rest and sleep periods were calculated by R algorithms. (A) Activity of one female non–BP-I volunteer, 59 y old, from a CO family. (B) Activity of one female BP-I volunteer, 58 y old, from the same family as A.

