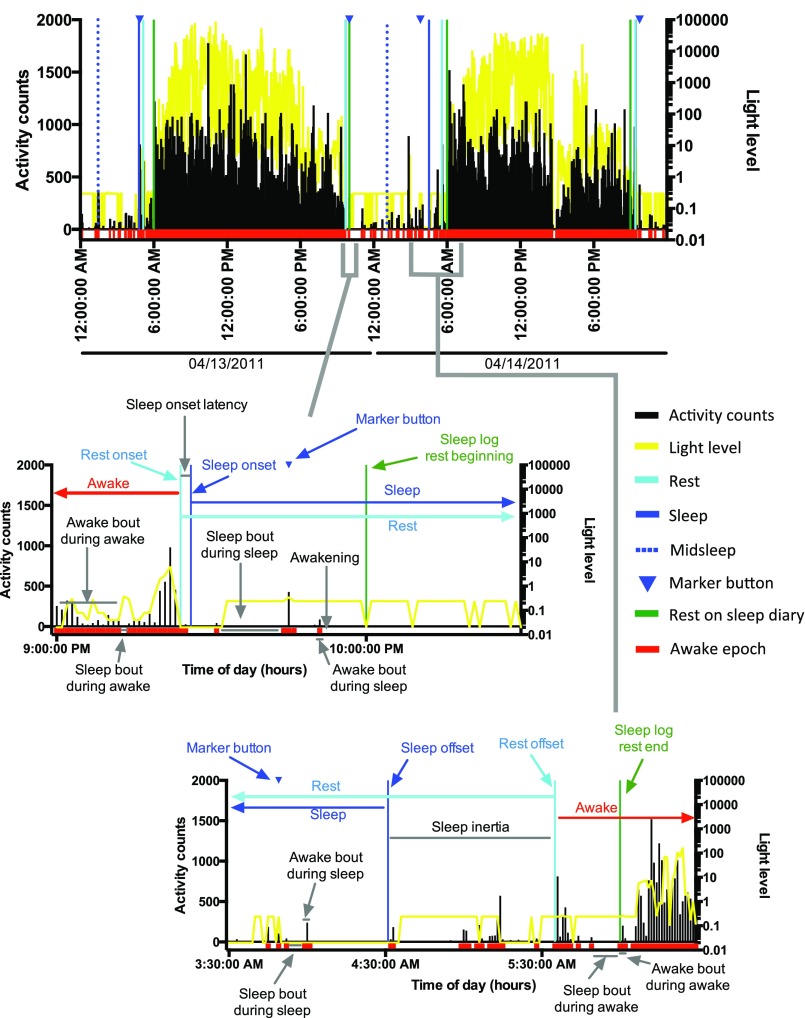
Fig. S5.
Example of phenotypes extracted during rest, sleep, and activity. Dark columns are activity epochs; yellow curve represents light counts. Red represents epochs scored as awake. Blue triangles indicate the epoch when the marker button was pressed by the subject to indicate bed time (rest onset and offset). Green bars represent the time that the subject indicated in the sleep log for rest onset or offset. Rest onset and offset (light blue bars), sleep onset and offset (blue bars), and midsleep time (dashed blue bars) were computed by a script in R, as described in Methods. Sleep onset latency is the time between rest onset and sleep onset. Sleep inertia is the time between sleep offset and rest offset. Examples of measurements of phase are the time of rest and sleep onset and offset and midsleep. Examples of measurement of entrainment, or fragmentation, are the sleep and awake bouts.

