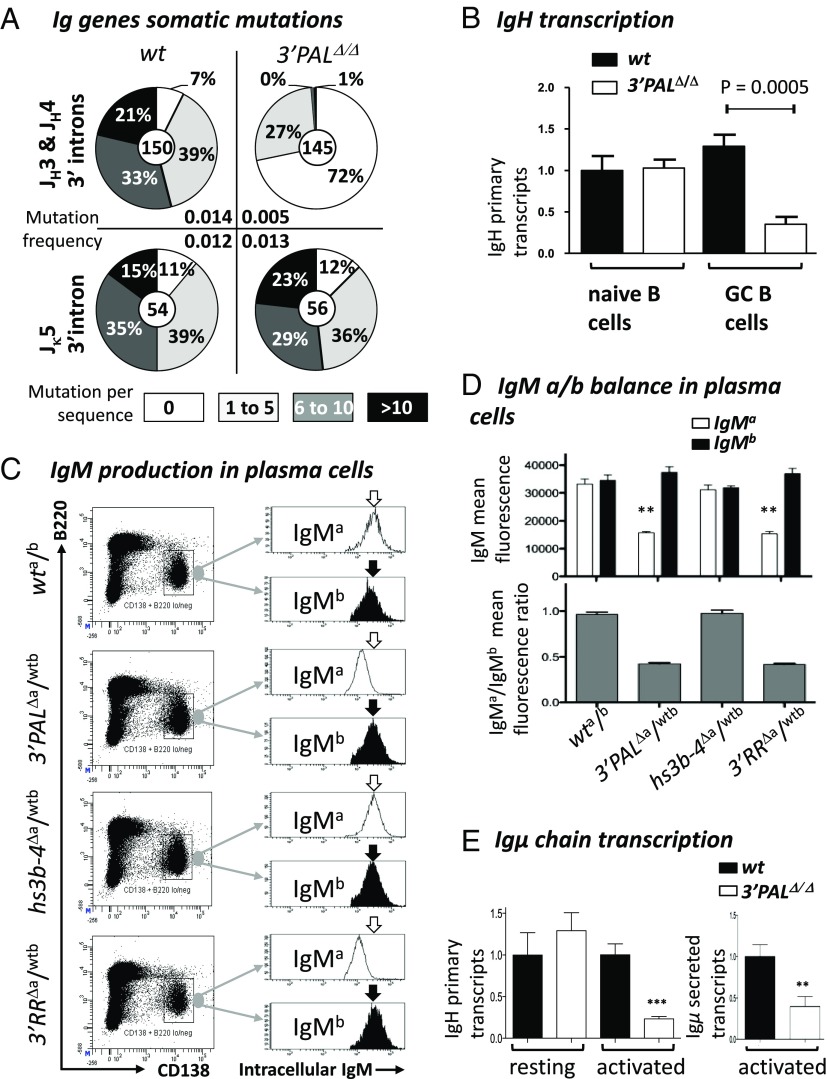
Fig. 4.
Proximal 3′RR module controls IgH somatic mutations in GC B cells and Ig production in plasma cells. (A) GC B-cell DNA was isolated from B220+ PNAhigh/FAShigh Peyer’s patch cells from unimmunized 8-wk-old wt and 3′PAL KO mice. Pie plots showed the percentage of mutated clones for each group (proportional to the area in each slice).Total number of clones analyzed for each genotype was noted in the center. Mutation frequency (mutation per base pair, indicated for each group) was calculated from sequences that contained at least one mutation; clonally related sequences were excluded. (B) Relative IgH primary transcripts was estimated by qRT-PCR, performed using IgHwt TaqMan probe and normalized to Cd79a transcripts (see Table S3 for details). (C) Intracellular IgM-allotype expression in plasma cells from heterozygous mouse models (wta/b; 3′PALΔa/wtb, hs3b-4Δa/wtb, and 3′RRΔa/wtb) was measured by FACS analysis. After sheep red blood cell challenge, plasma cells from the spleen were gated based on surface expression of B220low and CD138+. This specific population was assayed for intracellular expression of IgMa or IgMb allotypes. One representative experiment is shown. (D) Upper histogram shows mean fluorescence of intracellular IgMa (white) or IgMb (black) allotype expression (estimated by flow cytometry as described above) in plasma cells collected from at least five animals of each genotype. Gray histograms below report the corresponding MF IgMa/IgMb ratio. (E) IgH primary and secreted-Igµ transcripts in wt and 3′PALΔ/Δ B cells. (Left) Primary transcription of rearranged IgVH regions (normalized to Gapdh transcripts) was quantified by qRT-PCR in CD43− resting B cells from wt and 3′PALΔ/Δ animals). (Right) Transcription of the secreted form of Ig µ heavy chain was quantified by qRT-PCR (see Table S3 for details). Significant differences were indicated by P values: **P < 0.01, ***P < 0.001 according to the Mann–Whitney u test.

